
Low Latency Java Applications Synchronization Costs
Another class of problems deals with latencies. A symptom of a latency related problem can be lower than expected throughput in your application, without the CPU being saturated. This is usually due to your threads of execution stalling, for example due to bad synchronization behavior in your application. The Flight Recorder is a good place to start investigating this category of problems.
Open the 03_JFR_Latencies/latency_before.jfr recording (same procedure as when opening the hotmethods_before.jfr recording in the previous exercise). Then switch back to the Mission Control perspective.
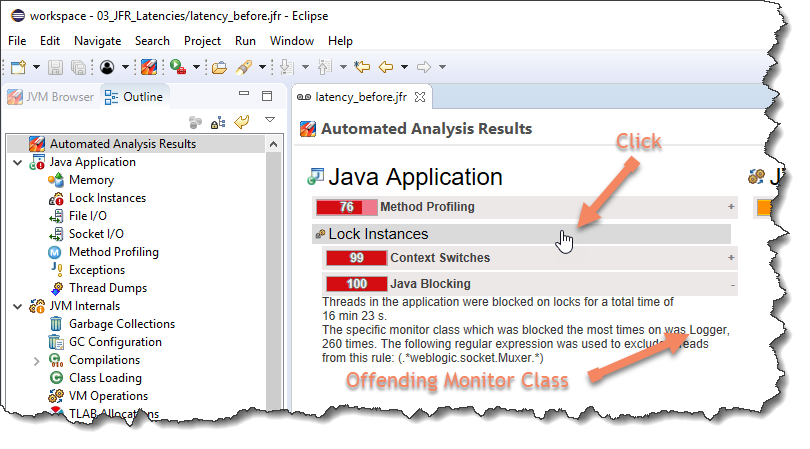
From the rule result our threads seem to be waiting a lot to enter a java monitor. We can already see what monitor class seems responsible. Click the suggested Lock Instances page to take a closer look.
Of what class is the lock we’re blocking on? From where in the code is that event originating?
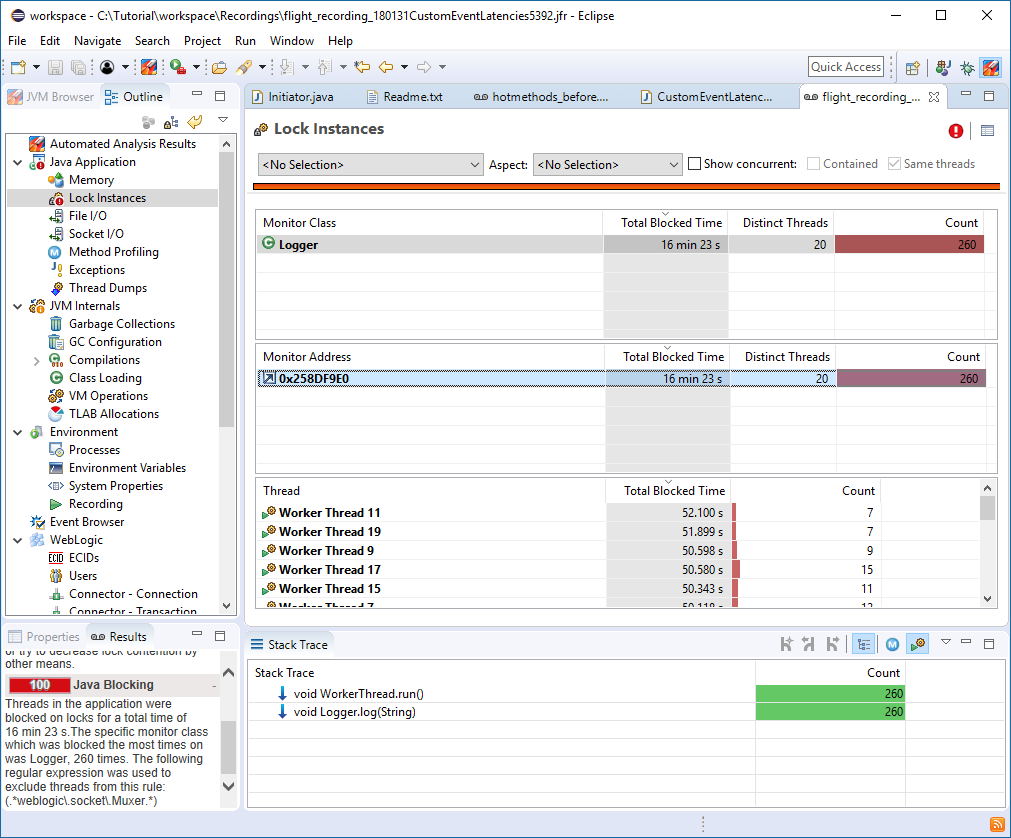
Note: In this case it is a very shallow trace. In a more complex scenario it would, of course, have been deeper.
It seems most of these blocking events come from the same source.
Let’s take a step back and consider the information we’ve gathered. Most of our worker threads seem to be waiting on each other attempting to get the Logger lock. All calls to that logger seem to be coming from the WorkerThread.run().
Can you think of a few ways to fix this?
Note: Right click on the Logger.log(String) method and select Open Method if running JMC in Eclipse. If not running in Eclipse open the source file and take a look at it. We get several matches; select the one in 03_JFR_Latencies. The method is synchronized.
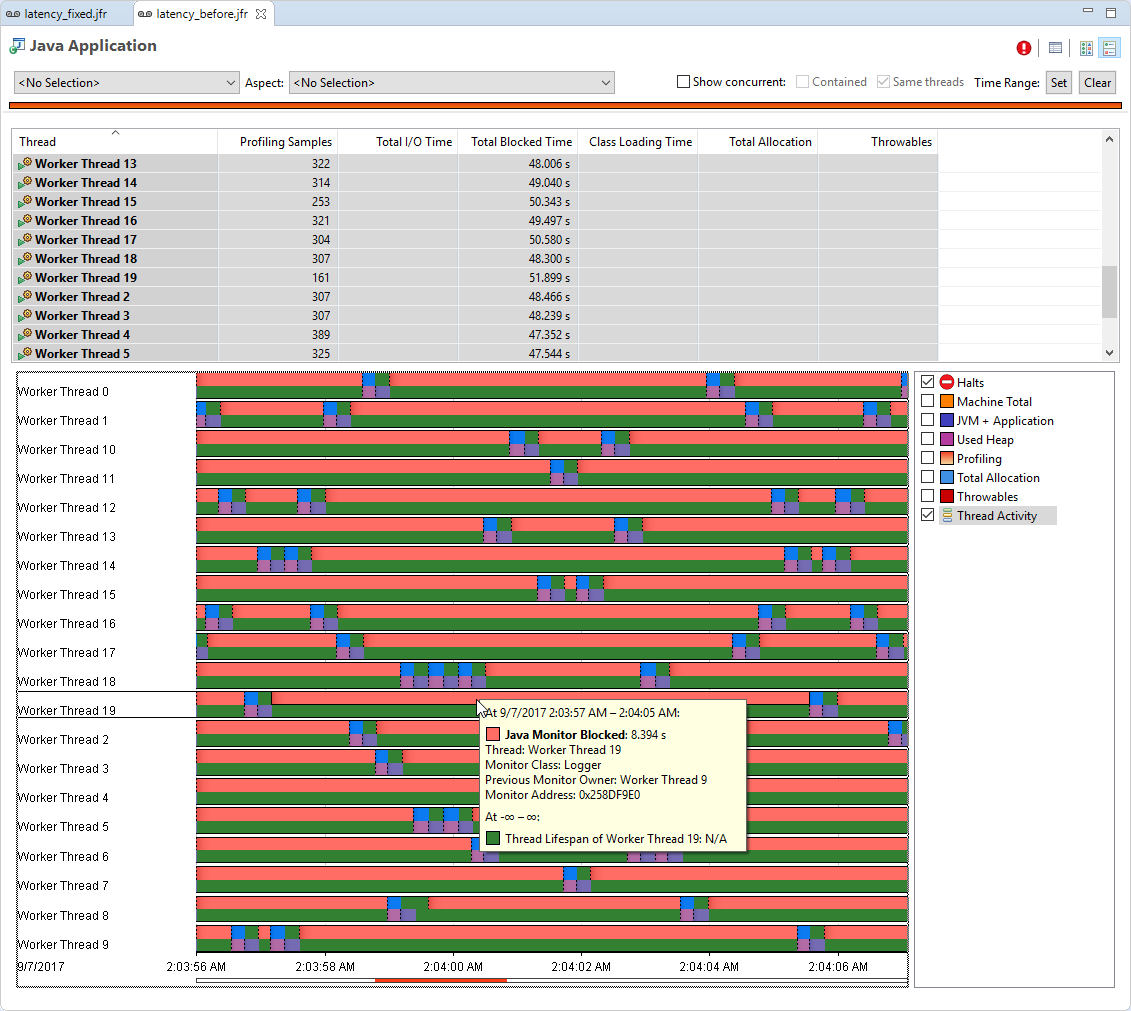
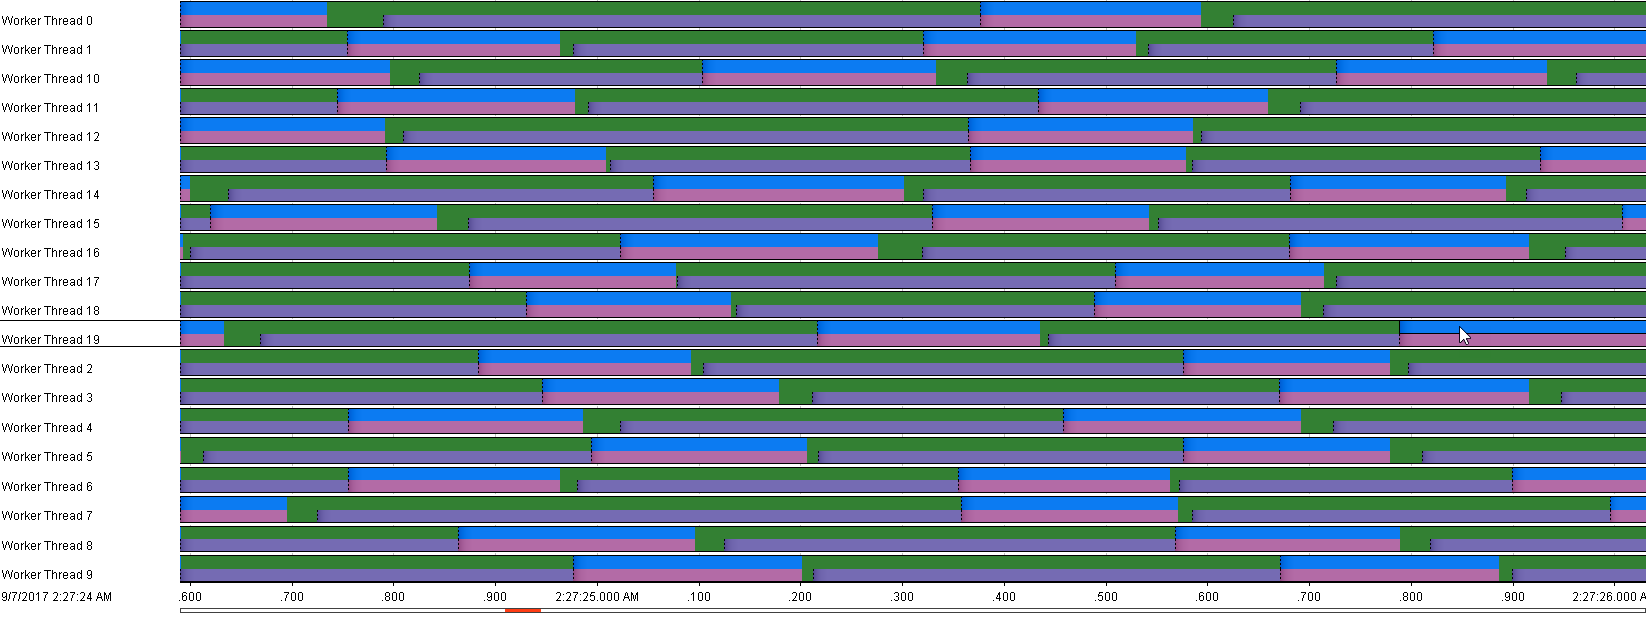
Note: The events can also be visualized directly in the Java Application view. Select all worker threads.
Note: More hints in the Readme.txt document in the project.
In the latency_fixed.jfr recording we simply removed the synchronized keyword from the Logger.log(String) method. Can you see any difference to the other recording? Are the threads getting to run more or less than before? Are we getting better throughput now? How many threads are stalling now?
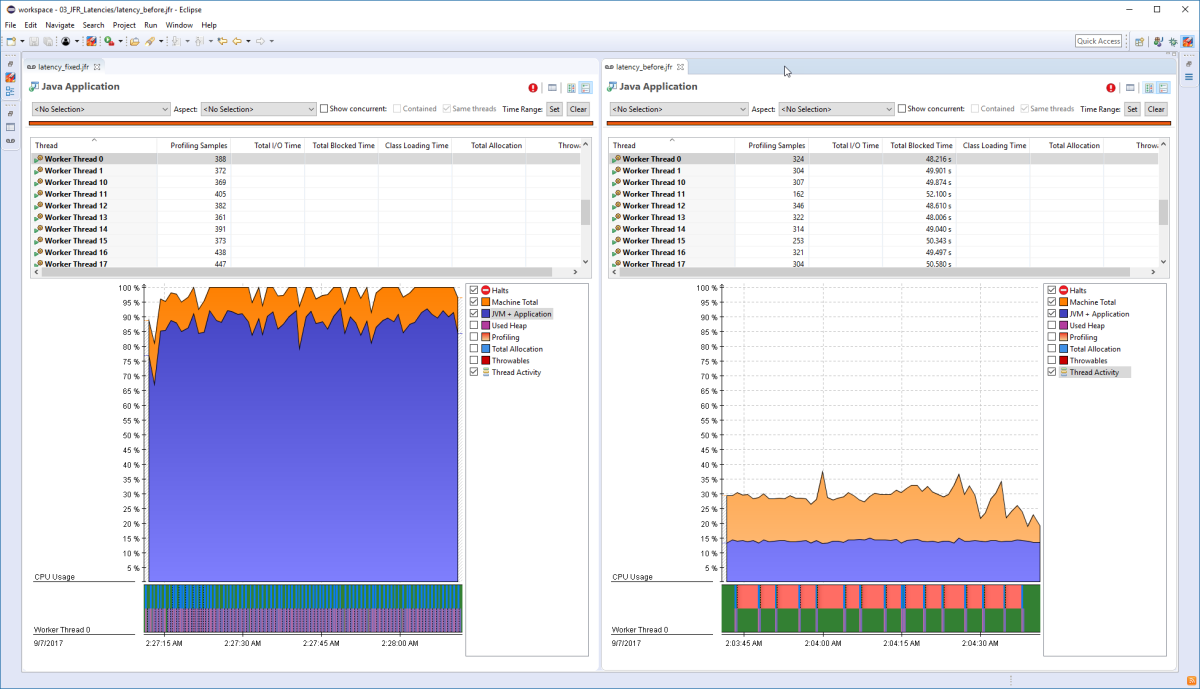
Note: You can compare recordings side by side by dragging and docking the editors that contain them in the standard Eclipse way.
Note: The CPU load can be seen in the Java Application tab.
Note: Green means the thread is happily running along (also purple, for our own custom Work events). In the latency_before.jfr recording only one thread is running at any given time, the rest are waiting. In the latency_fixed.jfr recording, they are happily running in parallel. Also, no salmon-colored Java Monitor Blocked events can be seen at all.
The moral of this exercise is that bad synchronization can and will kill the performance and responsiveness of your application.

Here are some additional videos and articles of mine (Cameron McKenzie) about Java Mission Control and Java Flight Recorder: