Heap Waste Analysis & Java Mission Control
There is an experimental plug-in available for JDK Mission Control which provides heap waste analysis. Heap waste analysis aims to find inefficient use of Java heap memory, and provides suggestions on how to improve the density of an application.
To use the Java Mission Control’s Heap Waste Analysis tool, it must usually first be installed. For this JavaOne Hands-on-Lab, however, it has already been installed into the Eclipse lab environment.
Open the file 11_JOverflow/jmc41dump.hprof by double clicking on it. This is a dump from an earlier version of Mission Control, which traded quite a lot of memory for a dubious performance gain in the JMX Console.
JOverflow in Mission Control
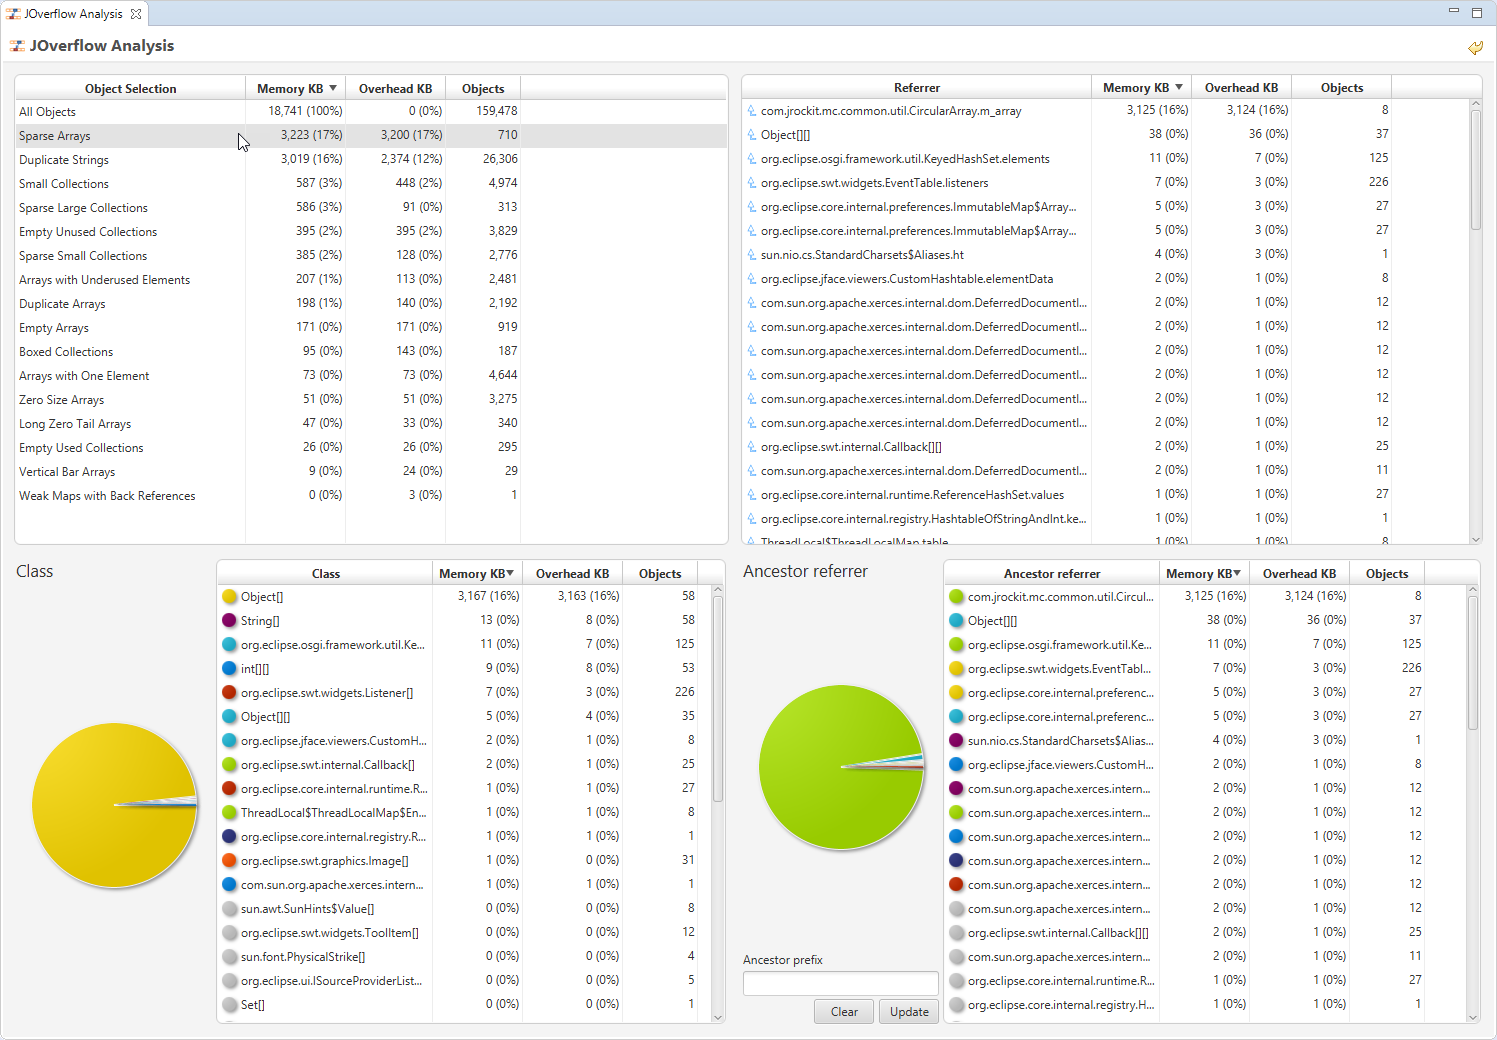
Within Mission Control, JOverflow will open, and show the contents of the heapdump. There are four quadrants in the JOverflow user interface. Also notice the little reset button in the upper right corner ( ). It will reset all the selections in the user interface.
JOverflow Object Selection
The top left quadrant, Object Selection, will show you what heap usage anti-patterns the analysis has found. The first column in the Object Selection table show the kind of objects found. The second how much memory they use in total. The third column, Overhead, shows how much of the memory was wasted, in percent of the total heap used.
Waste Analysis Referrer Tree-table
The top right quadrant contains the Referrer tree-table. This tree-table will show the aggregated reference chains for whatever is selected. Note that the way to reset the selections in the Referrer table-tree is to right click in the table. This is since you can make multiple consecutive selections to arrive at the reference chain you are interested in.
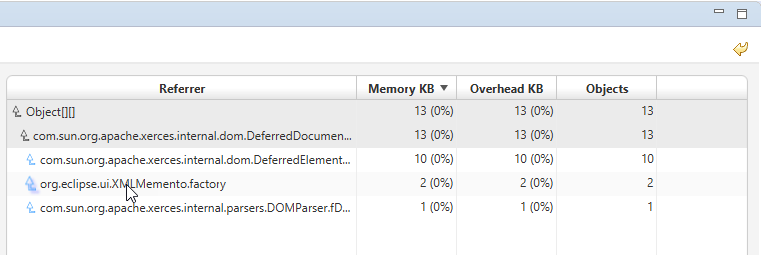
(Screenshot showing multiple available paths to select from)
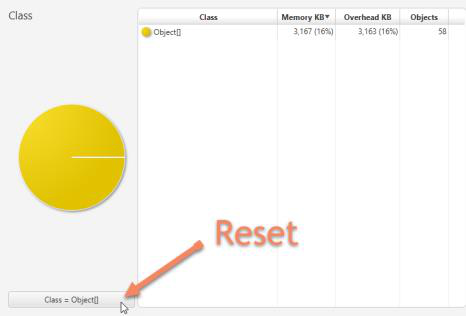
Heap Waste Class Histogram
The lower left in Mission Control’s Heap Waste Analysis shows a class histogram for whatever is selected, allowing you to filter on class. If you want to reset your selection, click the button representing the selection you have made.
JOverflow Heap Ancestor Referrer
The final table, in the lower right, will show the objects grouped by the closest ancestor referrer. It provides a pie chart to show the memory distribution, and filter box, making it easy to home in on to instances of classes belonging to specific packages.
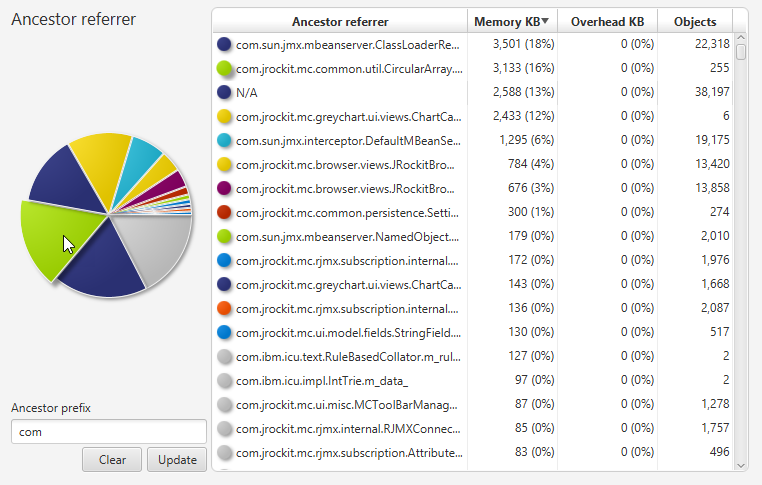
Note: it is possible to directly select a piece in the pie chart.
Reducing Sparse Array Memory Usage
It seems that quite a few objects used by this old version of Java Mission Control, are Sparse Arrays. This means that there are arrays with very few actual instances referenced to from them. In other words, they are mostly empty.
- How much memory (in percent of the total heap used) would be saved if the JDK Mission Control 4.1 JMX Console switched to a more compact representation?
- How many instances are holding on to all that memory?
- What is the name of the field holing on to those instances?
- Can you, just by looking at the names in the reference chain, figure out how these sparse arrays were used?

Here are some additional videos and articles of mine (Cameron McKenzie) about Java Mission Control and Java Flight Recorder: