JVM Memory Leak Causes
One commonly recurring problem is the memory leak. In Java, memory leaks are created by unintentionally retaining objects that are no longer of any use to the program.
Some examples of common Java memory leaks include:
- Putting objects in a collection (for example a HashMap being used as a cache), but never removing them.
- Adding a listener to an object in a framework, but never removing it.
- Putting an object in a java.lang.ThreadLocal, but never removing it.
- Keeping references to classes loaded in class loaders that are no longer supposed to be in use, or just simply keeping references to classes no longer required.
Unless the heap behavior of an application is actively monitored, a memory leak is commonly discovered post-hoc, when the JVM exits due to there no longer being any heap memory available (OutOfMemoryError).
How to solve Java memory leaks
One way to resolve memory leaks is to analyze the heap contents by capturing a heap dump (see JOverflow). There are, however, many practical problems with heap dumps and heap dump analysis:
- Heap dumps represent all of the heap content – they tend to get very large.
- Heap dumps of large heaps take some time to produce, during which the JVM is stalled.
- Since heap dumps, when originating from a production system, normally come from beefier computers than your laptop, they can be hard to process on a developer system at all.
- Heap dumps contain all the (potentially confidential) data on the heap. All your customer information, your company secrets… Be very careful when you handle heap dumps. Maybe they should not reside on your laptop at all.
- Multiple dumps represent a vast amount of data, making differential analysis very expensive in terms of both memory and processing.
Because of all of the above, you typically only do a heap dump when you know you will need one. This may require you to try to reproduce a problem that led to an OutOfMemoryError.
It would be quite useful to have some information from the production system allowing you to resolve the problem without having to go off and trying to reproduce it.
Flight Recorder’s Old Object Sample Event
Since JDK 10 the JVM has a new event available – the Old Object Sample event. It is very useful little event that can help solve memory leaks without having to do heap dumps.
The Old Object Sample events will contain a sampling of the objects that have survived. The event contains the time of allocation, the allocation stack trace, the path back to the GC root. Since you may want to keep sampling, but perhaps not calculate the paths back to the GC roots on every dump, you need to specify the path-to-gc- roots parameter when dumping the flight recorder.
For more information on Old Object Sample events, please see the Old Object Sample article on Marcus’ blog (hirt.se/blog).
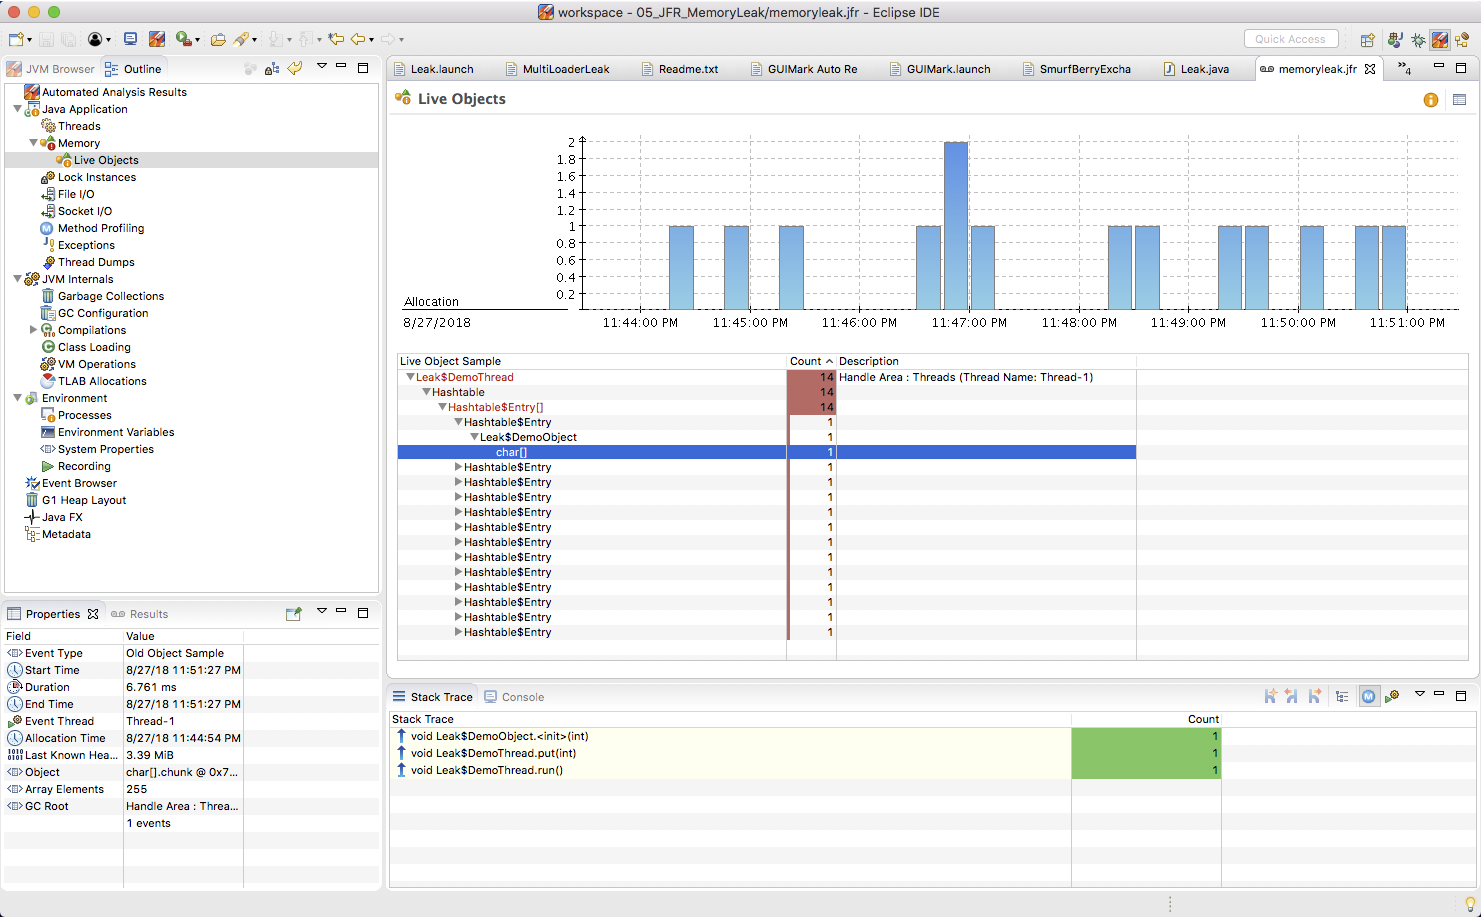
Project 05_JFR_MemoryLeaks contains memory leaking applications. Open the memoryleak_before.jfr recording. It was taken before the memory leak was fixed.
Select an old object sample somewhere in the middle of the interval.
JVM Memory Leak Tutorial Reivew
JMC- 6127 is currently being fixed – instead look at the full interval.
- Can you tell when it was allocated?
- Can you tell where it is being held on to?
- Looking at the source, can you figure out how to fix the problem?
- How many allocation events does the recording have?
- How many Old Object Samples are kept?
- Open the memoryleak_fixed.jfr. Do you see any differences?

Here are some additional videos and articles of mine (Cameron McKenzie) about Java Mission Control and Java Flight Recorder: