Java Mission Control and Exceptions
Some applications are throwing an excessive amount of exceptions. Most exceptions are caught and logged. Handling these exceptions can be quite expensive for the JVM, and can cause severe performance degradation. Fortunately, finding out where
exceptions are thrown for a specific time interval is quite easy using the Flight Recorder, even for a system running in production.
Open up the flight recording named exceptions.jfr in the 07 _JFR_Exceptions project.
The automated analysis should indicate that things could be better:
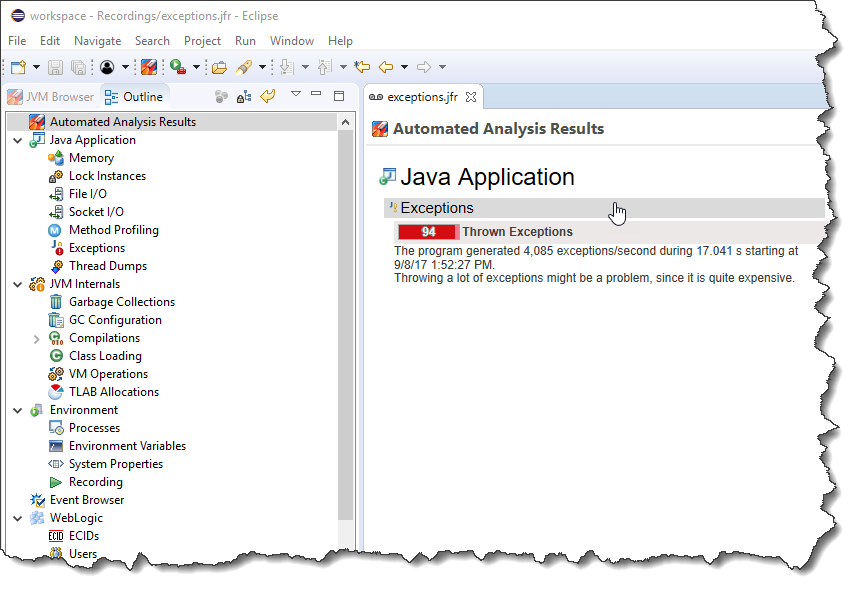
Click on the Exceptions header above the rule result (or the Exceptions page in the Outline) to go to the Exceptions page.
Can you tell how many exceptions were thrown? Where did the exceptions originate in code?
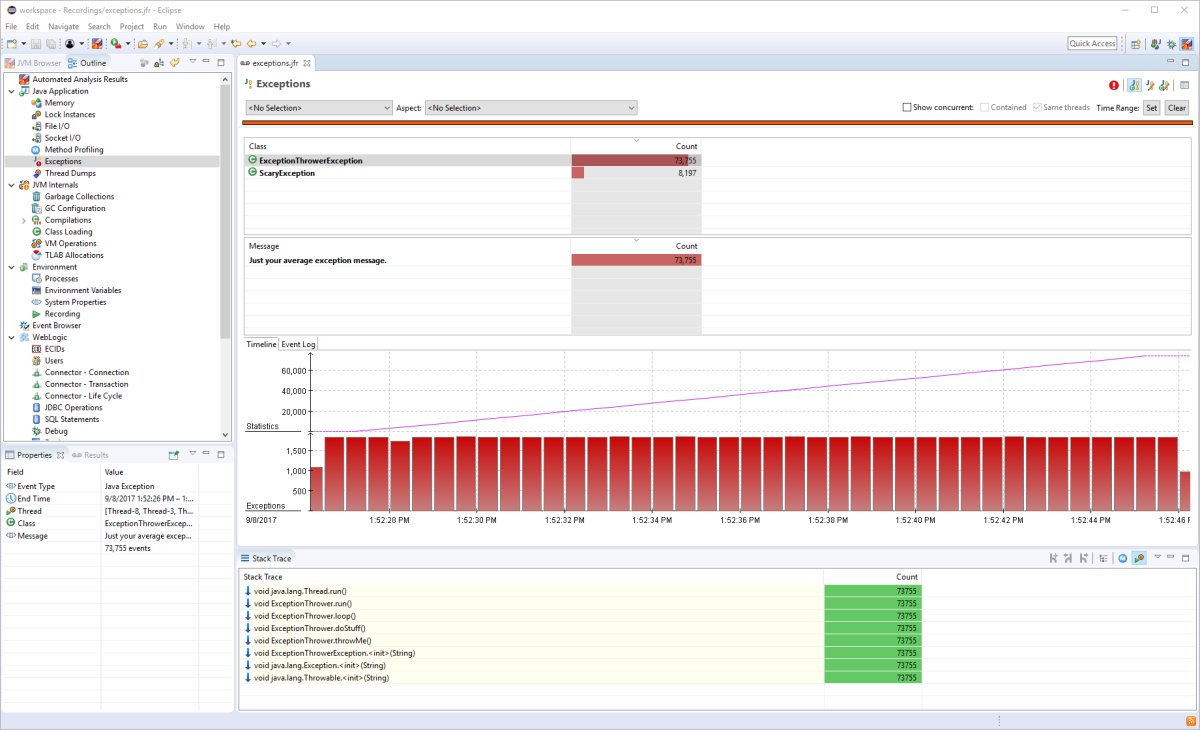
Note: Click the exception class you want stack traces for. You can also select multiple classes to see the aggregate traces for all classes in the selection.
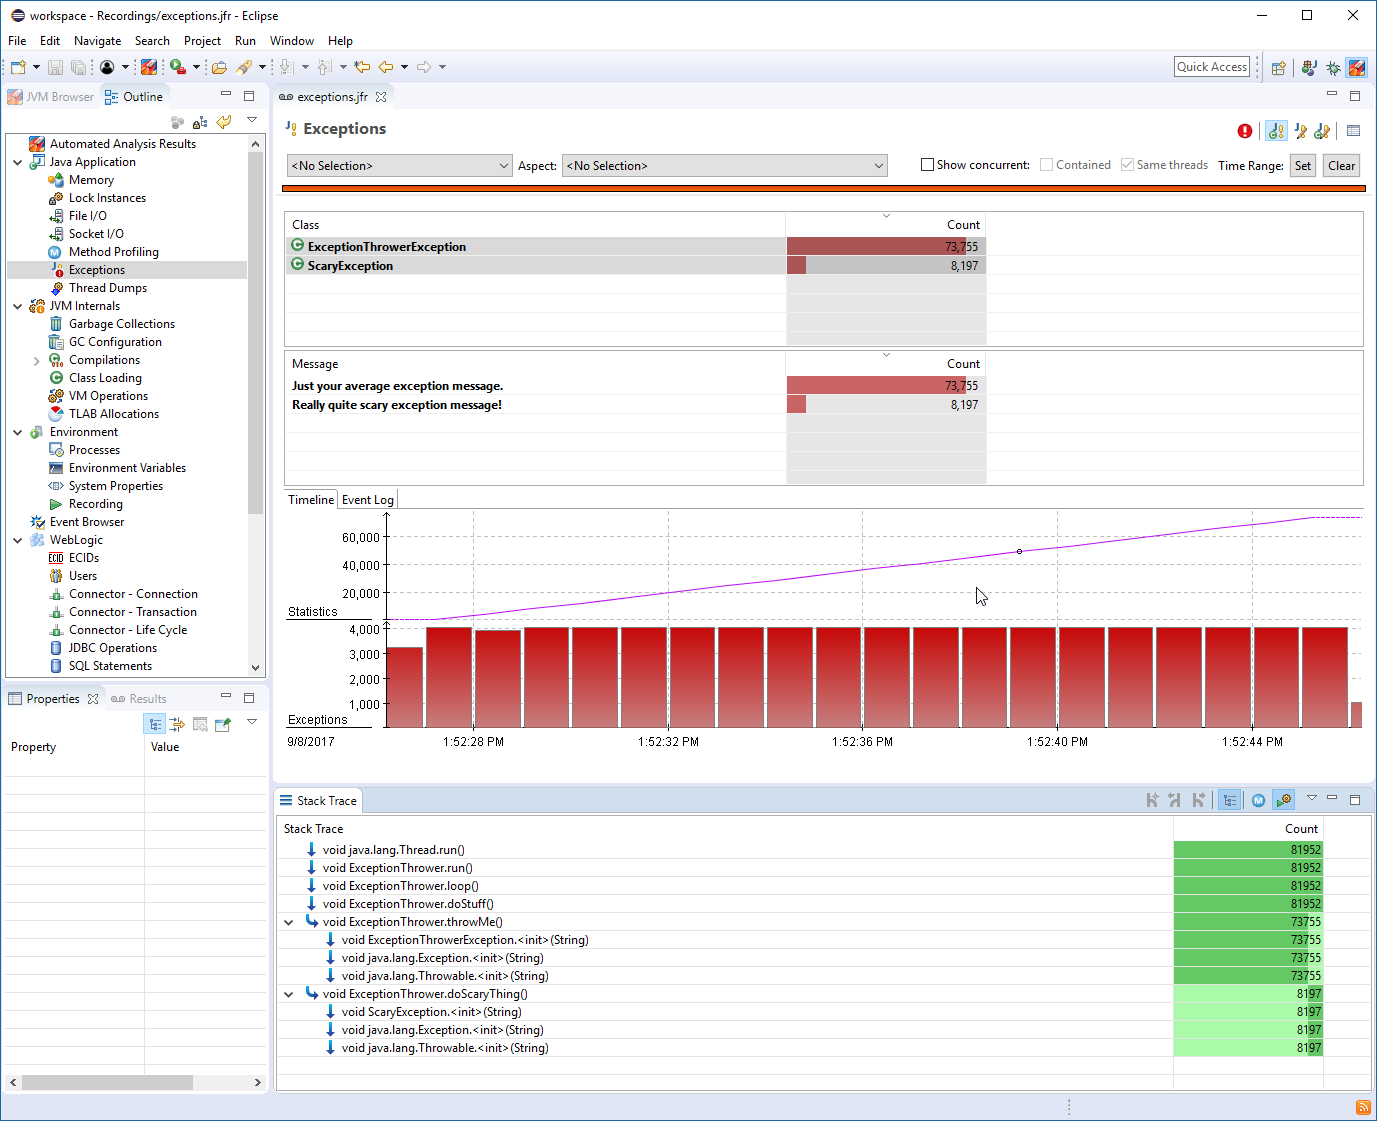
Can you tell exactly where the Scary exceptions are originating? In what threads are they originating? Can you study the time line for the exceptions in just one of the threads?
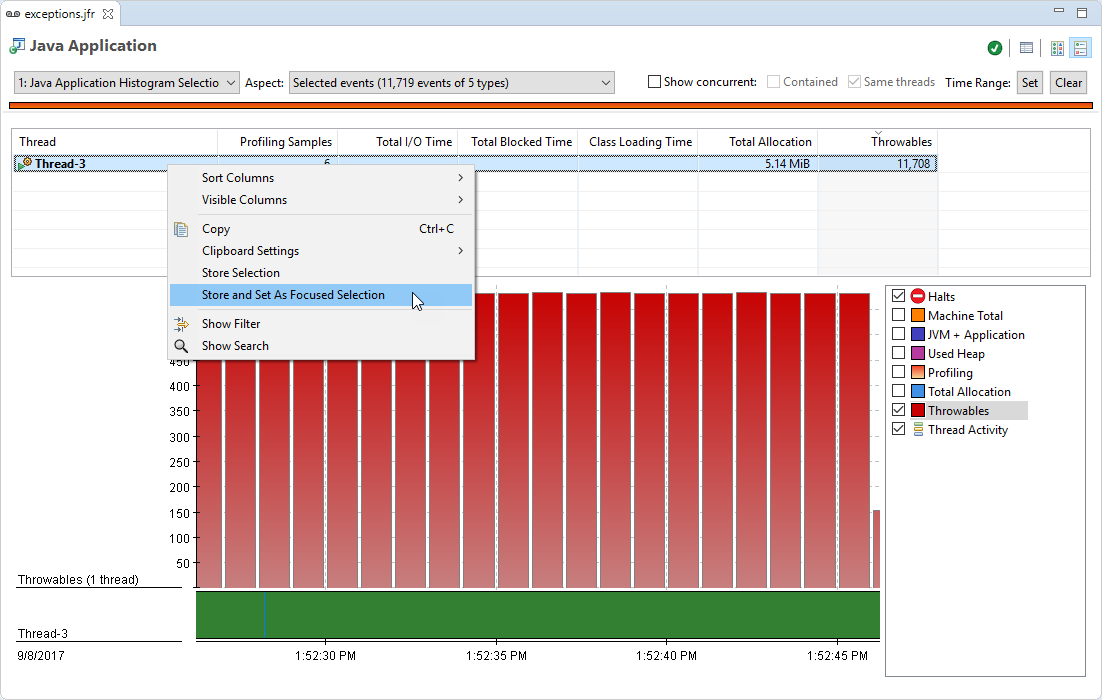
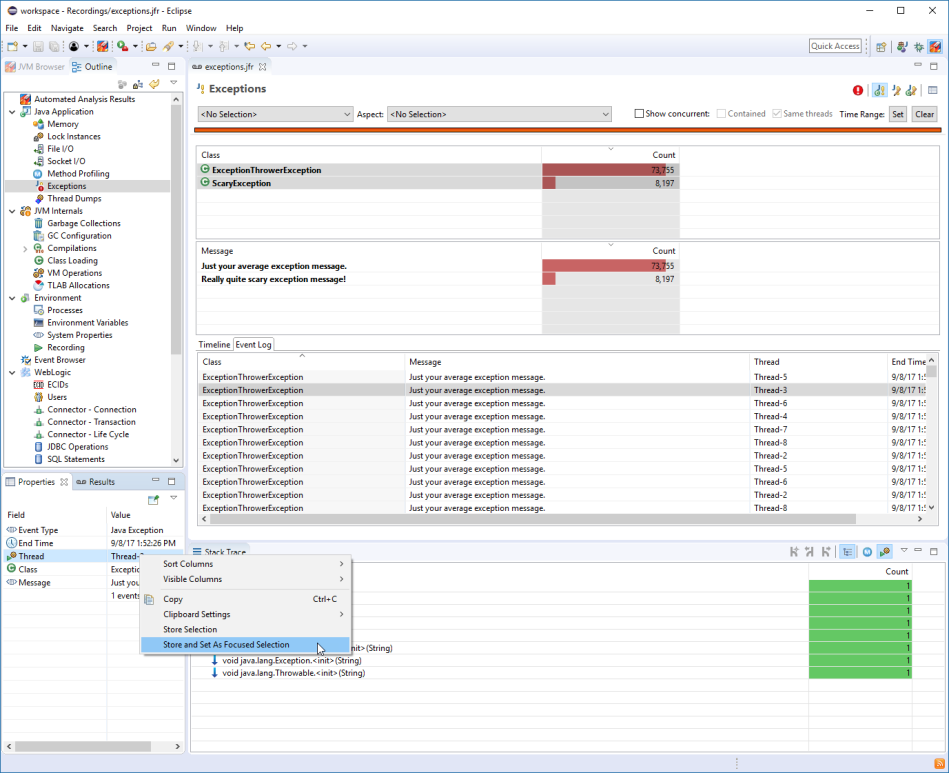
Note: Either go back to the Java Application page class, sort on Throwables in the thread table, and pick a Thread and select Store and Set As Focused Selection then go back to the Exceptions page:
… or pick an event in the Event Log directly on the Exceptions page, then select the Thread in the Properties view and use Store and Set As Focused Selection from the context menu:
Once a single thread has been selected, try zooming in the graph and switch between the two types of events, one each and both simultanously. Can you see a pattern?
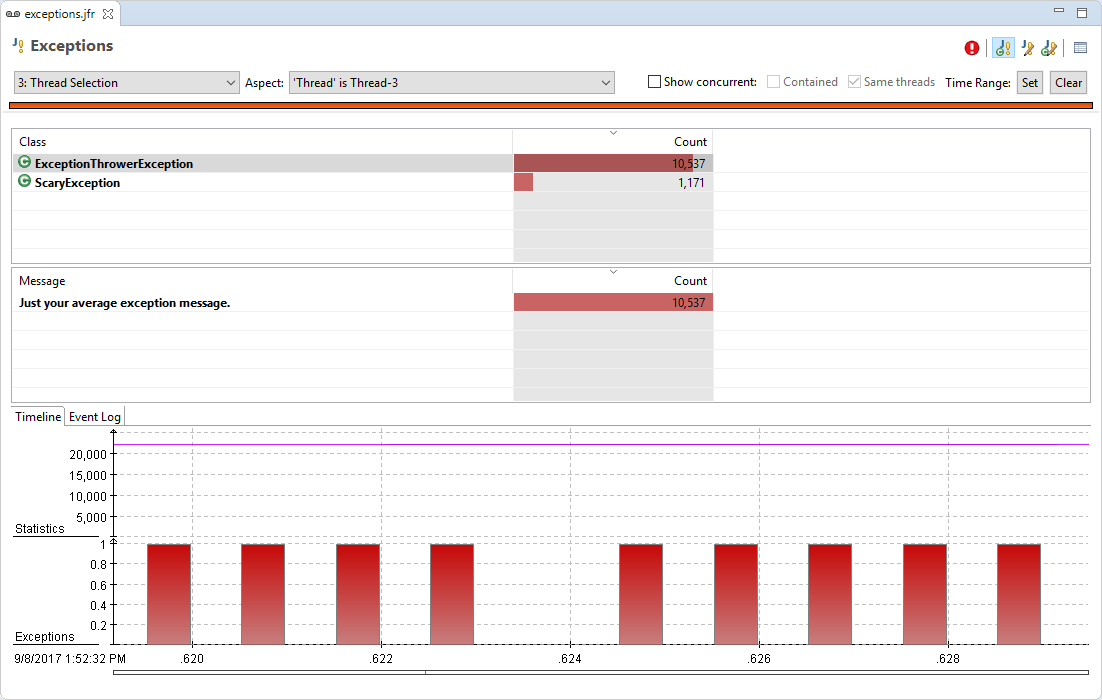
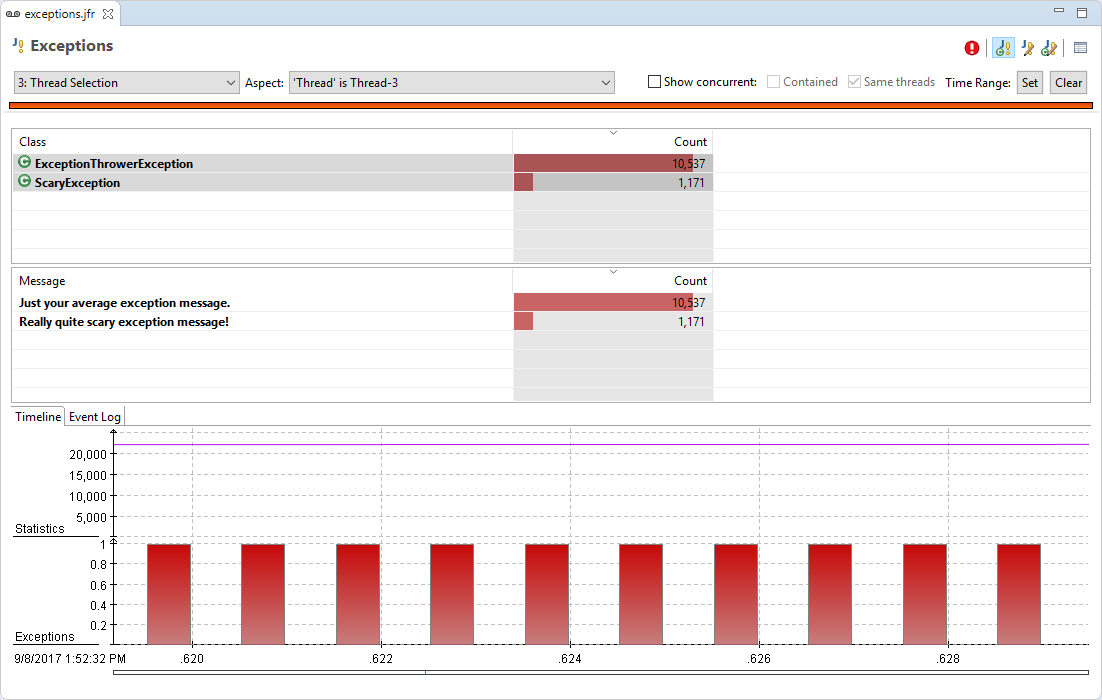
Note: Zoom until you can distinguish individual event buckets (the y-axis is showing 1).

Here are some additional videos and articles of mine (Cameron McKenzie) about Java Mission Control and Java Flight Recorder: