Java performance tips
Apart from outliers, pretty much everything you need to know about job performance is well-defined, there’s only concurrency and the outliers are difficult.
And the rest of it is really well-defined. You shouldn’t have any problems with it. It’s just a matter of knowing what look for, and that’s what I’ll be talking about, telling you all the techniques, you need to understand exactly where your performance issues are.
Is my performance objective reasonable?
Um, there’s, there’s, it’s quite straightforward. You just need to know what is, what is reasonable to achieve. So you’re trying to do something you need to know. Is this actually an outlier? Am I doing something that’s going to cost a fortune and I can’t achieve? Or is it something that’s quite reasonable to achieve?
And then that’s fine. If I know it’s reasonable to achieve, I can use standard techniques. So you need to know what’s reasonable to achieve. And then in order to know what you need to achieve, you have to have targets. Okay. So that’s step two have targets and then step three is just what tools you need to use when you know that you’ve missed those targets.
- Is it reasonable
- Is there a well defined target
- How do I refocus when a target is missed.
So I’m going to talk about, what is achievable now, for those three axes of performance? Um, no, I just want to know that stateful versus stateless matters. So just to explain stateful means you have a request and that will, that request needs to change something persistently. On the server or on the service before it can reply to you.
Stateful vs Stateless Applications
The bank account transaction is a typical one, yet it actually has to deduct the money from your account before it then replies to you and says it’s been successful. That’s a stateful transaction, a state. This one is where I send the request. And as, as long as it’s accepted the request, that’s all it needs to do.
And it can apply immediately. So status is much easier. And, Google is, is an interesting example because. If Google only had a thousand sites that it covered, literally anybody here could do Google. It’s like two boxes and one, one little dev team. You could, you could handle 40,000 requests per second, really easily because a search request is actually a stateless request.
What is stateless?
You send something, it doesn’t have to change anything on the server. They do change stuff on the server. What they do is they log the request so that they can later on process it. Um, so they they’ve got all the stats about who, what kind of requests and happened. But all of that be that isn’t sync synchronous that doesn’t need to happen.
Secrets they need to do is look, the request well they need to do is get the data from the backend. And that’s the real business advantage of Google is those massive data centers with a huge amount of data. But just in terms of status concurrency on a server, that’s really straightforward and quite simple.
So, if you can get your service to be stateless, you can move it over to some aspect of savers. It’s really, really easy to do.
Stateful Performance & CAP Theorem
Um, when you were stateful concurrency is different. There’s a theorem, the CAP theorem it’s about consistency, availability and partition tolerance. And if this theorem basically says you can’t have all three, so what we tend to do is you tend to look for either, either a globally consistent transaction site.
So there’s a. There’s a single database somewhere. It might be a huge database and all transactions have to go through to that database. Or you go for what’s nowadays a globally consistent, globally, eventually consistent transactions. They can be faster, but it means that, you have to worry about that lack of immediate consistency.
So here’s, what’s achievable. The, the database industry has a nice benchmark, the TPCC one, which would cover the. Stateful globally, consistent transactions. And that’s, that’s gives you an idea with one box. If that database is based on one box, you can have 2000 transactions the second where the five second response time for those transactions, that’s the kind of, that’s the bank account.
TPC-C Benchmark
All right. That’s where you’re doing a bank transaction for an eventually consistent one with one book. So I’m talking about like a standard. So, I don’t know, 32 cores, just something that you can easily, get off Amazon. one of those smaller, small, not, you know, it’s, it’s quite an easy, standard box to get.
Um, you can, you can achieve 300 per second with a hundred millisecond response time. So this is transactional. Okay. It’s not a stateless system. It’s a transaction system. That means you send, you’re sending 300 requests into that system and they are transacting on that system. Persistently storing change and responding to you within all of them within a hundred milliseconds, that’s achievable.
Okay. So when you’re doing stuff, this is an idea of you. So you need to know these are achievable. That means that if I’m not achieving this, I just need the tools to figure out why. So we had three axes. I had three axes there. The first was a concurrency. Second one is data. And. Data is slightly different.
Data Size BOundares
It’s not so much as achievable as the consequences of achieving different data sizes. There’s a number of boundaries. And the first boundary is the CPU cache, which even 10 years ago where it wasn’t that important, but Moore’s law has made the process so much faster, but the time for a memory. To get to the CPU, not any faster.
So it’s become important. Um, so you can get cash stores. You can get these pipelines on the cash. Everything is a cash line. So if you have two different variables that fit on one line, even though there could be even two different objects, but if there are two or could be two different variables in the same, same object, it doesn’t really matter if they’re fit on one line.
One cash line because that’s the way Java has laid it out. Then that means that there is contention. If you have two different threads, updating those two different variables, as far as the CPU is concerned, your two threads are updating the same thing. And they’re contending with each other, even though from the point of view of your application, there’s no contention, there, there is at the CPU level.
So you get, there’s a lot of different effects on, on the cache. Most applications don’t notice it because you’re already hitting these, but if you’re doing very highly concurrent application or a very low latency application, these become important. Um, and if you’re pushing a lot of throughput through the, through the cash, again, it becomes important.
Numa Node Memory Splits
There’s a very nice talk there that I’m linking to at the bottom, but it gives you a lot more detail on that. The next boundary is orders of magnitude bigger. That’s the Numa node. Okay. And the Numa node is you’ve got your, 32 core server, but it’s not actually 32 separate cores there. W what’d you have as a socket with eight cores and there are four of those sockets with eight cores and the memory of the system is split up between those sockets.
So nowadays you’ll have a lot of, you have two socket servers, four socket servers, and if you’ve got 256 megs and it’s a two socket server, With eight cores on each socket and that’d be 16 cores, but the memory of the 256 megs megs of Ram is split between the two cars, 120 H typically it can actually be a different, but typically there’ll be a split between them.
And that has an effect on the site size of the heap that is efficient. Okay. So. If it’s not actually just the heap, it’s the full process size, but you need to have all the data of the heap stick, stay on one of the Numa nodes. Otherwise you start getting impact its performance impact from that. So that’s something that you need to be aware of if you’re looking at very big heaps.
Um, and there’s, there’s a focus in Java nine. G one garbage collector, to improve the support of also Numa nodes and very large heaps. And, there’s an item down there that I’m saying it’s worth getting off heap. quite often when you have very large datasets, the next boundary of course, is the total Ram.
So not there’s the Numa node Ram. And then there’s the total Ram. You don’t exceed the total Ram because then you’re paging. All the time and it’s really, really performance impact. So you’ve got, you’ve got a couple of orders of magnitude though, that you can, you can lose, especially when garbage collection hits and then boundary.
Disk Space
The next boundary is clearly the local disk space. Because once you’re up in that area, you want to do a lot of heap work. And if you can do it, if you can keep it within the system, that’s much more efficient because otherwise. Yeah, over on to the final boundary, which is remote, persistent storage, it’s your database or your no SQL database or whatever you want to call it.
and it’s remote and there’s a lot of it’s it’s, it’s much more difficult to get good performance from that. Um, so. For example, you have to be really careful about the type of access, the type of updates you’re doing, because each of the, no SQL one solutions, they’re all optimized for different patterns of behavior.
## The Right NoSQL
I need to do a lot of analysis there and I, I speak from experience when I say that it’s painfully expensive. If you, if you’ve done the wrong thing with the wrong, no SQL database. You tend to hit the limit before you realize you find that you’ve done the wrong thing. And then it’s, it’s, it’s really painful.
Um, it’s, there’s, there’s, there’s like this there’s, about 30 or 40 that that’s reasonable for you to use it. they’re all different. There’s there’s a huge report, I think from, that’s a J lobby. That’s like the just, cause I think it is, they’ve got one of their reports give, lists them all.
Okay. So the third axis we’ve done two axes concurrency, data size. They’re really both important. The third axis is response. obviously that depends on your app. But then assuming you can get your app down to whatever latency you need to reach. The garbage collection tends to be the limitation. And again, stateless versus stateful.
Stateless can give you faster times, and you need to be aware of jitter. So a hundred minutes seconds, as I said already, if it’s a stateful responsiveness at scale. So I’m talking about at, I’m not talking about one request, I’m talking about hundreds of requests per second. So at scale. 100 milliseconds is achievable, for a stateful response.
That means that it includes the transaction on the service and the things that you have to watch out for, to avoid that is replacing large data structures. I mean, typically it’s reloading an XML config or, some document, but really it’s any large data structure you need to do in place replacement. If you’re editing the data and not replace the whole thing, because it’s replacing large data structures that really impacts both object creation and garbage collection.
Concurrent Mark Sweep (CMS) collector
And typically you want to use the Concurrent Mark Sweep (CMS) collector because a hundred milliseconds is. Um, challenging pause time to achieve in a stateful, transactional system. Um, and there’s a problem with Concurrent Mark Sweep (CMS) collector, because you can achieve it with Concurrent Mark Sweep (CMS) collector, but it, it has it, so it doesn’t defragment, as it goes, you build up.
A fragmentation with Concurrent Mark Sweep (CMS) collector. All you ever do is delay that however much you tune it, you’re just delaying the fragmentation at some point, it’s going to go, Whoa, I can’t do any more. I’m really fragmented. I have to pause and do a huge long pause, like 10 seconds, 20 second pause. Craziest pause times.
Cluster Pause Times
So a typical technique to handle that apart from using. Somebody else’s garbage collector. I’m talking about the Oracle ones. Of course, typical technique is to use a clustered system and you take one node from the cluster, actually stopped servicing, stop sending requests that node and just force the garbage collection.
That’ll defragment it. And then you can put it back into the node. You do that sequentially with all the nodes in the cluster, and that works really well. I’ve I’ve had that in production for years now. Stateless responsiveness is easier. Of course, stateless is stateless is always easier with everything.
Shorter response times
40 milliseconds is the human perception limit on dealing with real-time voice systems. So we need to hit a 40 millisecond pause time. Maximum 40 minutes seconds is actually quite easily achievable with a stateless system, 20 milliseconds, not too hard. You, you need to do a little bit of garbage collection tuning or maybe not at all, but.
It depends on your application. When you’re targeting around five milliseconds, you need to do garbage collection tuning and object tuning. So it’s object, lifecycle tuning. You need to cut down on object, churn, object allocation, you start doing pooling objects, which is ugly, but that’s the kind of thing to keep.
Object’s not, not having a churn. And then two milliseconds to in seconds is really hard. So. Two milliseconds and down you, you have to change your style. It’s like eighties program’s style. Okay. It’s really different. You can’t have any GC pauses at that stage because pretty much you can’t guarantee that you’ll hit two milliseconds.
So at that stage is kind of, you want to avoid GC pauses, zero copy of objects, do all the object creation, initialization upfront, and then it’s this very much. In data structure in place processing. And the other thing, if you need to have some objects generated over the runtime, then you can have what you do is you have a very large heap.
End of day restarts
And then you can restart the service once a day. Obviously, if it’s a 24 seven application, you can’t do that. But a lot of the banks will use this kind of technique because they have a day cycle where they can restart at the end of the day, it closed the business hours. So they’ll just have a really large heap and it doesn’t matter if they’re doing, they’re creating a few objects.
That’s okay. For, for really low latency, you’re hitting 10 microseconds. The OS gets in the way, and there’s a very nice talk down there by Mark Mark Price. he’s from the Elmax team, if you know, Elmax disruptor, if you’ve ever heard that, he’s part of that team and he gets quite a lot of very interesting detail there on, How you have to, what you have to do to move the earth out of the way.
I would say that it’s, it’s not, it’s not techniques that’s beyond anybody. I mean, we’re not talking about hedge fund techniques, hedge fund techniques are hardware. Okay. They’re putting FPG A’s in there to get hardware scale sub microsecond. they’re doing the work in hardware and, and it’s, that’s completely different.
This can be still done in software. It’s just. techniques that it doesn’t take that long few weeks a month and you can be up to speed on that. Um, so it’s, it’s, it’s, it’s achievable, but you need to understand these techniques are this the kind of thing that you have to rewrite from scratch? So I’m not going to go through these, but there’s a bunch of designs at the design level that you need to avoid.
As I said, you can download the slides and read them all, but if you’re doing any of these design things, then it means you need to do a rewrite. So it’s about avoiding the wrong things. So there’s, you can’t. There’s design level things and architecture level things, but you can’t use a tool to figure out a neck, which we’ll just get you around.
JDBC Page Sets and Performance
You have to do a full rewrite, and these are the kinds of things that a design level. So the typical one, the one down at the bottom, not paging. That’s. Oh, S level paging that’s if you’re returning a huge dataset, you need to return pages of the dataset. It’s a standard JDBC type thing is it’s a standard in JDBC standard mechanism.
If you’re, if you start returning huge data sets, then that means you have to have a huge dataset in memory, which then gets dumped and you’re just churning masses amount of memory. So it’s just not possible. So this is a. This is another point where you can, you can leave now because this is the full troubleshooting diagram is fine.
I didn’t do this at all. This is Oracle team did this, so it’s a very detailed troubleshooting diagram. What to do, what utilities to run, what metrics to follow. If you have a problem with your system, if you don’t have the metrics, you need to turn them all on. Of course, but that’s not that terrible because your problem will still be there.
So you’ll still be able to see it. And it’s a very nice, comprehensive, methodology there of, of what, of the flow for troubleshooting.
Always a bottleneck
So one item to, to bear in mind, there is always a bottleneck. Okay. People think, Oh, there’s a bottleneck. I’ve got to fix it. That’s not the case. If there’s no bottleneck, then it’s takes no time at all.
And you’ve got the most fantastic program you’ve ever in. Anyone’s ever written or it’s HelloWorld right. Um, so there is always a bottleneck that doesn’t matter what matters is failing to achieve the targets that you need to do now. Most programs, most performance guys will tell you, you need set program performance targets upfront.
You need to do it at the design stage. And it’s kind of true. You need to, but it’s not terrible if you haven’t, because what you’ll have is your system out there in production, you haven’t set targets and at some point. People are going to say something is slow. And at that point, you’ll need to set the target.
You need to specify what exactly is it that slow and what is the target that I need to achieve at that point? So it’s not. Obviously, if he’s in it, right. We wouldn’t have any technical debt, which is a great position to be in, but we do have technical debt. We don’t do it all right up front. So it’s not an irrecoverable point.
Shared Resources
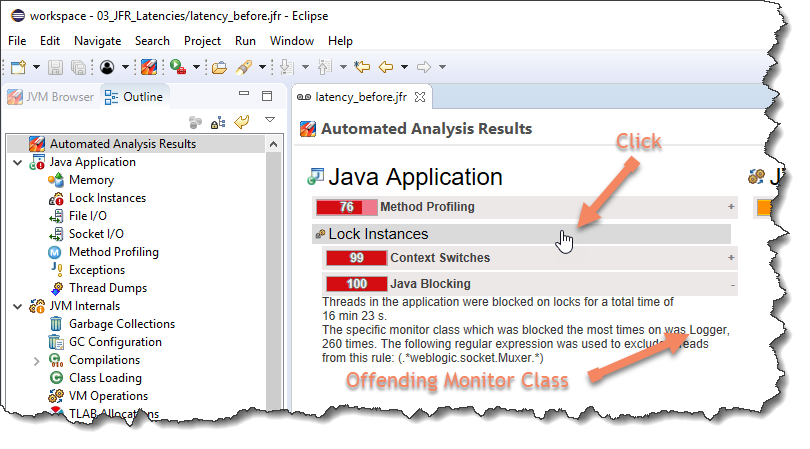
You just need to decide that, to understand that at that point, you need to specify a target. And then, then you look for the bottleneck. So it is usually a shared resource and this is, another slide here, which I’m not going to go through. But just to mention the bit in bold at the top, you do have those shows, resources.
Everybody mentioned CPU, memory, and IO. But the locks are critical share resource. Okay. So when your system is doing nothing but being really slow that’s because of locks, they use, you’re looking at CPU utilization and your ex and the system seems to be overloaded. And there’s no CPU utilization. There’s memory is not overloaded and IO is not particularly bad and you’re going, what the hell is happening?
It’s because it’s locked. So you just need to bear in mind that there’s for high level resources that are shared. Again, it’s a, this is a reference slide. So when you get the slides, you can look through them. There’s things to monitor at the application level. And there’s common problems with some solutions at each level.
And these are all slides that are left in there as reference points for you to look at what I’m going to look at, are these the most common problems. So these are the ones that have been repeatedly reported in various surveys by people as the most common problems they’ve encountered. In systems that have caused them to need to, to address performance.
So I’ll give, hopefully by the end of the talk, techniques to handle every single one of these and to identify what the problems are and then, the rest of it’s quite straightforward. Okay. So just starting, it’s an interesting title.
The most common. Cause of downtime is human error. Okay.
That’s like Amazon’s AWS outage, human error, almost all the major outages tend to be human error, the most common cause of downtime that is not human error. Tends to be resource leaks is historically that’s the case. When we, when, when there’s been any kind of surveys and resource leaks, memory leaks, very typical JDBC connections running out of, running out of those file handles and dis space.
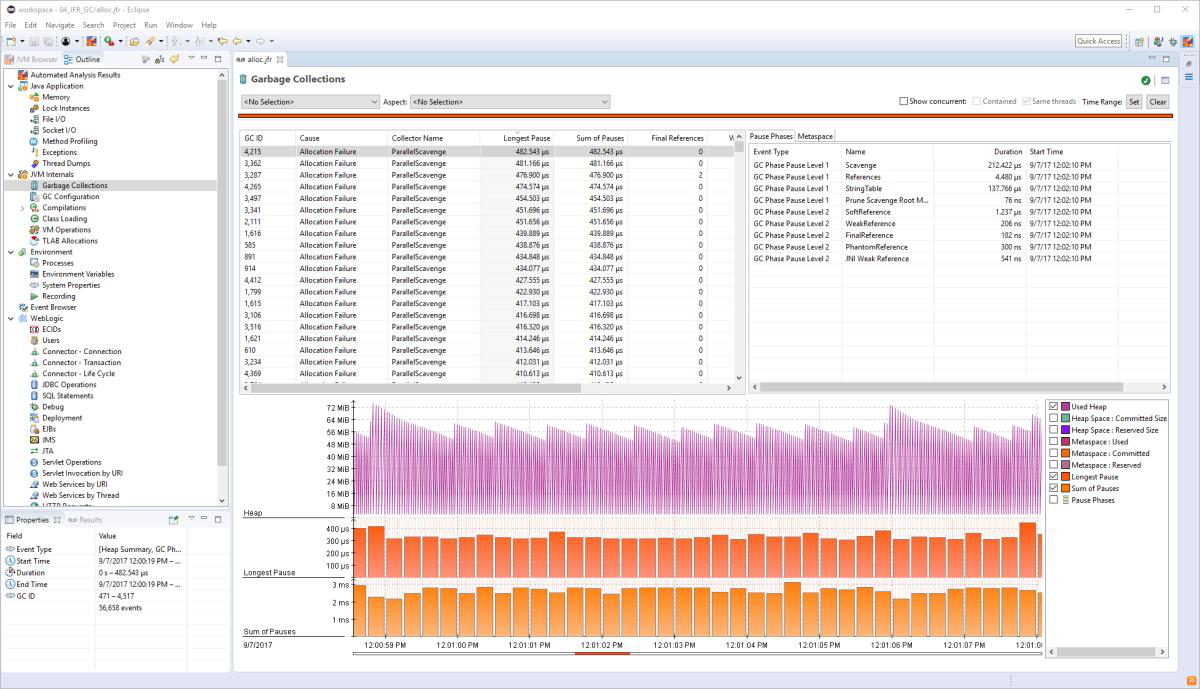
GC Logging
That’s, that’s really common. So the, the one I’m going to focus on, which is the most common one we tend to see in Java is memory leaks. Um, so stage one, Is that you should turn on GC logging. Okay. This is the first tool that you should have on your system. There’s negligible impact on having it on. Um, there’s a bunch of, flags I’m suggesting you turn on, in Java nine, it’s changed completely because there’s a universal logging and, it looks like that.
Um, There’s there’s, I’ll go through a couple of them very quickly. This, this one it’s misnamed. It’s not print GC application. Stop time. That’s the name for it, but it is actually print safe point application stop time, which may not mean much. It doesn’t matter if you don’t know what safe points are, but it doesn’t mean that you get lots of.
Stops, not just the GC stocks, you get context, which has stops. You get lots of other stocks, locking global lock stops, and they’re all listed when you turn that flag on. And it’s quite interesting. Most of them don’t matter to you like this, 0.0002. So that’s a, what does that to 20 microseconds and my that, they’re interesting.
If you like to see how much context switching your applications, do. So that’s quite a good one to turn on. And then these ones, you know, it’s a fairly standard. What I just wanted to show you a log line in case you haven’t seen it, you got the date. I like to have all the, all the dates. Time information there, but as you can see, it’s, it’s the actual log line.
Garbage Collection Explained
When people first look at garbage collection logs, they think, Oh my God, this is really difficult to read, but actually it’s just, it’s fairly straightforward. It’s telling you which, which garbage collector it was the heap before. There’s a little arrow, the heap after the heap, that’s possible for that space.
And then there’s like a total and then there’s a time. And then there’s user. CIS and real time, and they’re all, they’re all quite useful. Um, I’m not suggesting you learn how to, how to read garbage collection logs, but if you need to. Don’t get phased by all that text. There it is readable. And Java nine, as I said, it’s, it’s all changed.
The formats it’s designed to be, be more consistent and useful for tools. And there’s a nice talk by Tony princess that if I’m just going to do a really quick heat primer, just so you understand about the spaces, there are two spaces there.
There’s a. Young generation and old generation, the young generation is split up into Eden and to survivor spaces.
The old generation is also called tenured and. Prior to Java eight, you had the perm space from Java 8, this meta space, meta spaces outside the old generation. So is perm and they’re kind of different, but I’m just gonna one quick garbage collection. So you get Eden. That’s where all the purple objects are.
Um, for this case, they’re by definition, everything in Eden has age zero to get a little, little numbers of the ages of the objects across the top. There. So this is, you won’t necessarily see survivor space full up, but it can be. So this is, this is when a garbage collection happens. A young generation garbage collection happens.
When Eden is full. Okay. The only time it doesn’t happen when Eden is full is the, the tenured space needs a garbage collection. And it does a full garbage collection sort of halfway through Eden being full, but almost all the garbage collections. You’ll see. It’s when Eden is full. That’s what triggers the garbage collection, a young generation garbage collection.
So Eatonville, and this example, I’ve got lots of dead objects. Those are the ones with dots in and a few live objects. When the garbage collection comes around. And at the same time in the survivor space, you’ve got lots of dead objects because it’s, it’s been a while since the last garbage collection and a few that are alive.
So what the garbage collects does, is it copies over? So let’s go back. I’ve got ABCD down there in purple. They’re a zero. They get copied over to the other survivors space. The one that’s empty, all the rest, it just ignores it. Doesn’t care about them. And then it copies over from the first of Arbor space.
The objects that are still alive and the dead ones, it doesn’t care about. So you end up with just the live objects. Eden’s nice and empty. That’s a garbage collection. And I’ll just skip back again. So you notice down there in the survivor space, we’ve got X and Y if you look at the top, there, there are three ages, old, three garbage collections, old that’s their age.
There’s a parameter that says, if they’re a certain number of ages old, then I’m not going to copy them into survivor space. I’m going to copy them over into the old generation. So this example, I decided that’s going to be four, so you can not be up up to age three, and then you move over to the old generation.
So. When it’s clearing out survivor space, all the rest will get copied into the survivor space too. Except those, those ones that are hit, hit that age and that’s the that’s called a tenuring threshold. There’s a parameter that sets that. And the reason for that is because it’s inefficient to keep copying objects.
It’s an actual copy. It’s not just the pointer, readdress. This is quite inefficient. So you don’t want a copy objects a lot of time. That is what takes the time and the young generation pause. So, You don’t want to keep doing that. The idea is that if they’re going to last too long, then they’re probably going to be around for a long, long time.
Finalize Method
So just throw them over to the old gen the tenured space. This is a quick aside, and there’s a finalized method in object. If you don’t override it, the JVM knows to ignore it. If you do override it, this is the situation you’ll have. You’ve got all these purple objects are the same inside the instance of the same class, which overrides, finalize all the dead objects should normally the garbage collection, they would all be ignored and we’ve just got X, Y, and Zed over there.
They’re the only ones that we’d be copied, but if you finalize them, they all get copied at the end of the garbage collection because the garbage collector says, ah, okay, these are all dead, but. Their life for me, because I need to run the finalized method on it because it’s an overwritten finalized method.
You get this really ugly view and it is really ugly where you filled up survivor space and you’ve overflowed into Italian space, dead objects. Okay. And that’s really, really costly. So, I mean, I’ve emphasized I’ve over. Overemphasize things by having the entire aid and full up with these finalized objects.
It’s an unusual for that to be that’s a pathological situation, but you just need to understand. That’s what it looks like when you override finalize on an object. So you just that’s ugly. So, as I said, I, I try and avoid reading joke, GC logs. I can read them, but I try and avoid them as much was like, I much prefer using a, a utility that views it.
Um, I use GC viewer there. There’s a. I maintain a page. There there’s a list of, quite a lot of them, including. So all the tools that I’m talking about here are free tools. Um, as with everything, if you pay, if you get, if you use a paid for tool tends to be better. I wouldn’t say that all the paid for tools are better than all the free ones, but certainly the best tools, all cost a bit of money.
All the ones I’m talking about are free tools. And that’s the one I prefer. It’s quite good. It looks like this. So I’ll just go over it a little bit, which is you’ve got, you’ve got this jewel scale on the, on the left hand side, it shows both size. Heap size and the time taken for the garbage collections.
And then along the top, you’ve got a lapsed time and you can toggle that to get actual time. If you’ve set the date stamps in, into the log file, and then it, there’s lots of, lots of carloads. You can turn them on and off and they. They tell you the young generation side, the old generation size, and well garbage collection.
So remember what happens is the Eden gets full and then it’s emptied out. So you’ll get this Sawtooth line, which is at the bottom. Eden is empty. And then it gets full and the next slide that’s the garbage collection. And then it goes down even as empty. So that’s typical and GC viewer also shows some full GCs, which you want to avoid.
So this is a, this is an example of. If you have a quick look at this one, it’s a really straightforward example. You see these every hour on the one hour on the two hour, this is long black line. We’re doing a full GC every hour. And I’ve seen actually a lot of applications do this because if you engage the RMI system, even if your application isn’t, but something else is it automatically turns on this distributed garbage collection.
Which will force a full GC every hour property to turn it off. Basically you just set, set it, set the time interval for that to be really long, but I’ve seen a lot of applications where this happening and not people not even realizing because for the most part, it doesn’t matter. It’s only when you have the pause time targets that it matters.
Perfect GC
So this is a perfect GC. The blue line down the bottom, that’s the sore tooth it’s going up and down, up and down and down and you see that it’s not increasing at all. So basically what’s happening is that all the objects are being created, Ethan, and then nothing is ever flowing over to a. To the tenured space.
This is apps. This is perfect. If you can achieve this awesome. You can achieve this. Okay. But if you can, it’s obviously it’s like a little one that I did and you can’t, you probably can’t see, but there’s a green line. That’s the time taken by the GCs. If you can see it on the scale, it’s actually 0.1.
Milliseconds. So less than a millisecond pause times consistently, if you have an application, a real-world application that does that, please tell me, I would love to see it. This is more realistic. This is the kind of thing you see with spikes and things, and it’s going up and down. Now, this is also kind of, kind of thing you see now it looks, looks okay because you know, okay, what’s happening is you’re getting overflow.
So the blue lines spike, it’s sore two thing up and down, but there’s, there’s, it’s overflowing. Some objects are overflowing into the tender generation. So it’s gradually going up. And then obviously when it hits the heap size, It, it, it needs to do a full GC and then it’s goes, that clears out the tender generation because by then those objects are dead and so they can all be cleared up.
Um, so it looks, it’s not too bad, as long as it’s bad, if you can’t afford the time, the time pause for the old generation, doesn’t look too bad, but I’m going to scale out and it doesn’t look so nice now. And this is a typical object leak, a memory leak. Okay. So. The very first way you can identify memory leaks before they start impacting your application is to look at the garbage collection log.
And what you’re looking for is the yeah. After the full GC, the bottom point after the full GC is gradually increasing. So it’s, we’re not talking about the sore tooth, the blue lines, when the blue line reaches the top, you get a full GC and it, and it clears out as much as it can. Because you’ve got an object leak.
That means that gradually, that space is being filled up and each time it tries that it can only release less. There’s less able bottom line. The very, the very bottom of those points marginally increasing. That’s an absolute standard memory leak, an indication of a memory leak. So just use that and you, so you can identify that way before it starts impacting application in this case.
Heap Dumps
He let it run. Eventually. It just does continue full GC and your application comes to a standstill. So the typical things to do is a heat dump. There’s a number of different ways. You can use the heat pump on a memory or a flag. I never do that because that means that your application. So I’ve got systems with four gigs, eight gigs, 16 gigs, whichever they freeze.
Okay. At that point, when they’re doing a dumping out of memory error, they freeze and that’s. That’s not when you want it to freeze, it’s just going to freeze and do that memory dump. and then, and it doesn’t die until the memory dump is over. Assuming it does die. So something like Tomcat, we’ll just catch the error.
Memory dump vs Heap Histogram
It’ll do the memory dump, but it’ll carry on. Um, I tend not to do that. I instead have alerts on the system looking for memory leaks, and then I will explicitly do well. I’ll take it out of the cluster. Most of the things I deal with are clustered. I’ll take it out of the cluster and do an explicit. It’s a memory dump using one of the, one of the different, techniques that typically J map.
That’s the one I like to use the most. So, yeah, they’re, they’re big. Um, I’m just gonna do a quick detour. Cause there’s an alternative to memory dumps, which is the heap histogram. So that’s just, again, J map with a minus histo flag. And that gives you it’s much less overhead. There is still a freeze, but it doesn’t take as long.
And it’s just gives you a nice histogram is this is exactly. This is output. Just tells you in order. The class with a number of instances and how many bites they take in total. I’m sure you’re used to that kind of nomenclature where the square bracket means an array. B is a byte. C is a char eyes and integer.
All the rest is class names. So square square bracket, L Java Lang object. It means it’s an array of objects and that’s obviously going to be the internal of an array list. That’s the typical thing there. Let’s see. Yeah, there’s a 40 407,000 of those and 329,000 array lists. And most of those are probably a radius.
Um, so this is, this is a much lower overhead. It’s the sort of thing you can do periodically in production. Not too often. It does have costs. You can do it periodically. And it’s really easy to load this into a spreadsheet with another later version and do a comparison against them and see what’s changing.
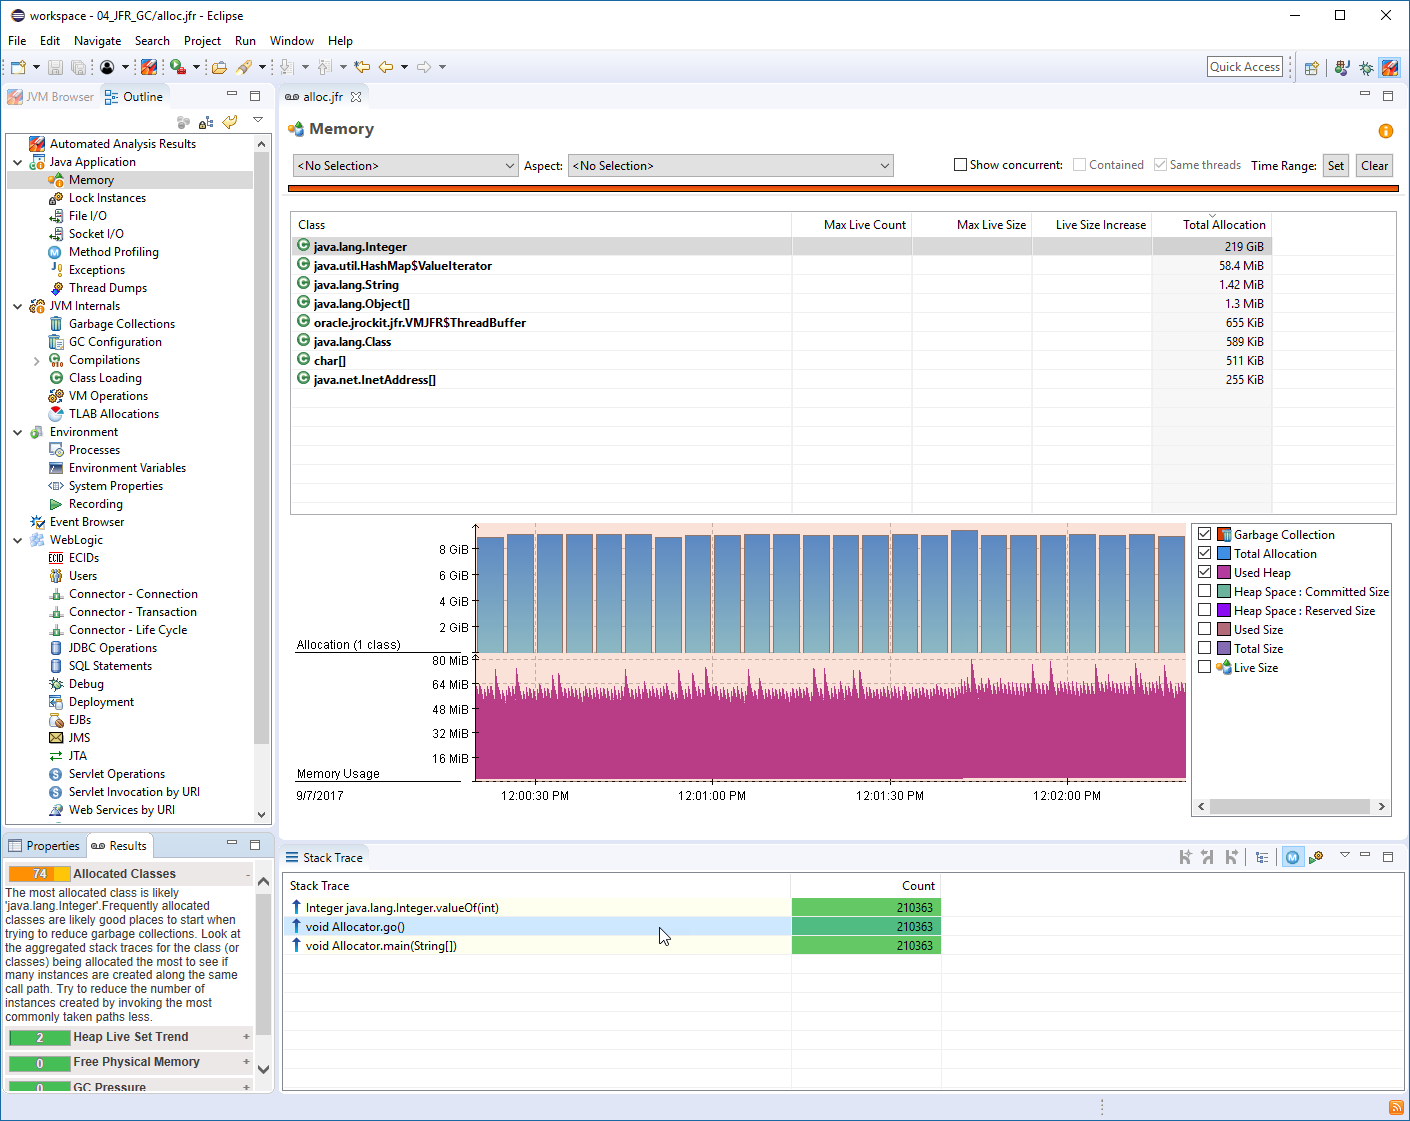
So it’s quite a cheap way of finding out memory leaks. So fair enough. That’s a detour. If you can do that, if you can’t. You can, you need to do the dump analysis? Whoa, I am cutting it close. Okay. This is memory, the eclipse memory memory analysis tool. It’s really straightforward. You can just go to the dominators panel.
Inspect Heap Histogram
You find the one that’s that’s that’s taking up all the space and. Open it open up the tree until you find the, in this particular one. I’ve I’ve it’s, it’s a classical fast leak and it’s got a cache, no straight straightforward, really easy to use. I’m going to go straight through tuning the heap. So generation count, the K generation count is there’s a little explanation there it’s basically long-lived objects.
They like. You generate them initialization. There’s one, two, three, four, five ages. And they all live for a long time. So when they get to the 10th generation an hour later, there’s five generations of them and short-lived objects. They all die quite quickly. So there’s only like five generations of them.
But if you have leaking objects, then every generation, there’s a new leaked object. So the number of. Of generations of it, of an object is a good indication of a memory leak. So this is what you can do again, this is. Not again, this is, JVs UVN. Um, and don’t use this in prod, never use J visual. There’s no profilers that are appropriate for production.
there’s a few paid ones. There’s no free profiles that are perfect for for production. Um, This is a really straightforward mechanism of finding out, memory leaks in, in development. Just look for the generation count. Um, so I’ll just give a quick talk here. I’m just going to go through J visual VM.
It’s got a lot of features, profiling and sampling. They’re two different things for execution profiling. You want to use the sampler for memory profiling? You want to use the profiler? Okay. I have two more things, two more techniques. So I’ve just got time for them, which is why I’ve skipped through that.
Everything’s in the slide and it should all be explained, understood by the slides. I just wanted to go over a JDBC logging. This is, this is really straightforward. It’s JDBC is built actually very nicely. A lot of people complain, but it’s actually very nicely as a plug-in component. So it’s very easy to plug in your own component that wraps the JDC JDBC layer.
And there’s quite a few JDBC tools, logging tools out there. I use peace, expire them. I’m used to it. I’ve used it for a long time. The only thing you have to remember about JDBC is that it uses that paging mechanism. So. The request that you send doesn’t return all the data in one, go at some point, as you, as you iterate through results set, one of those will trigger another request for more data.
So when you’re looking at logging, it’s not the initial, the initial time is not the time taken for the full execution. It’s there are, there will be like, if you look at individual logging statements, you’ll see. Individual results. A lot of them take zeros time and then one will take some, some milliseconds.
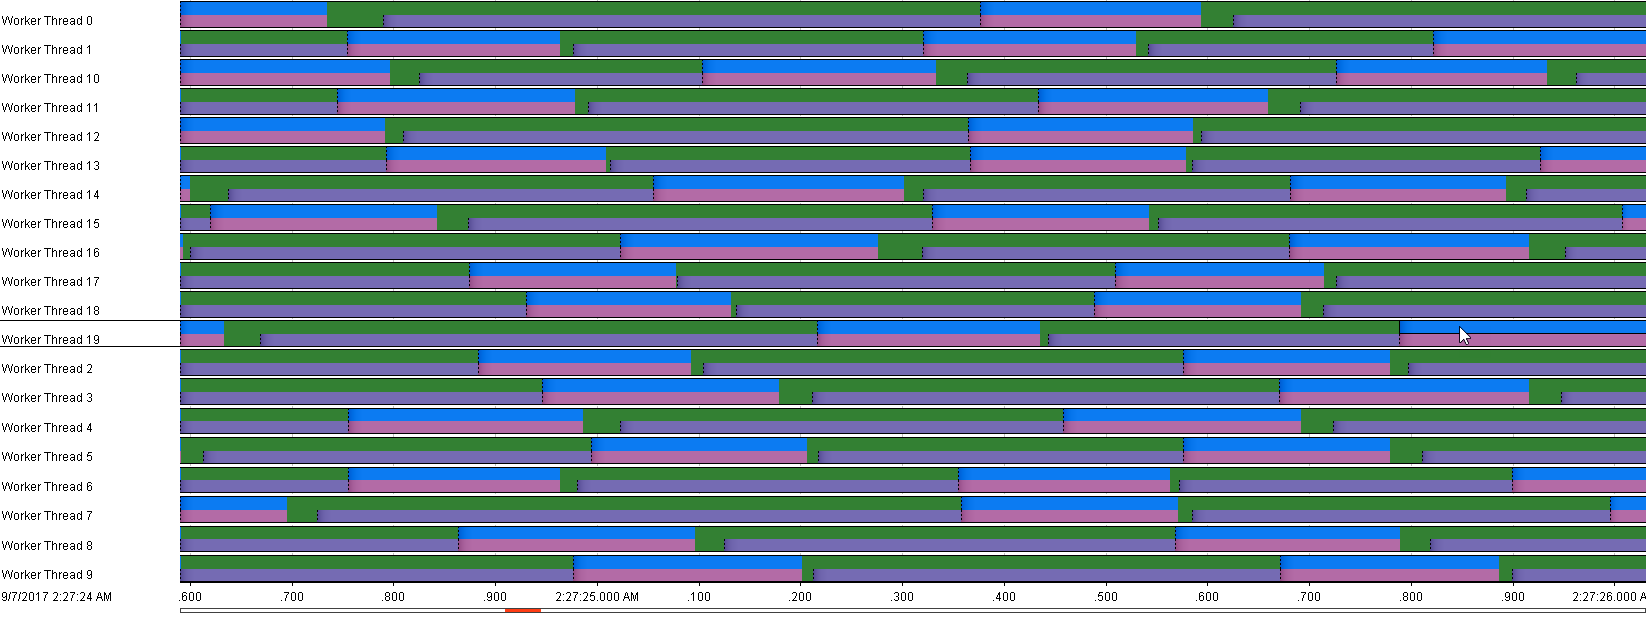
Cause it’s the next patch. That’s really straightforward. Again, it’s a tool you can use in production. It’s really easy to, and it identifies exactly where you have problems on the, on the JDBC side. Um, okay. I’m not doing too bad now. Um, so concurrency. It’s kind of the last set of tools that you need for analysis, and you need to determine pretty much what’s happening and.
The only standard kind of tool is actually just thread dumps, dumping threads. You just have to not dump too often. And what I mean, there, there are, there’s, there’s a few other things here. Like there’s the J stack minus Sal that gives you actually lock information from the Javi talking current classes.
Deadlocks
Um, and there’s a few techniques in terms of you immediately get deadlock information. information about synchronized monitors from the stack traces. And there’s also, there’s a thread Amex beam, which gives you some useful information, but pretty much the, the main thing to do at the moment, I would love to have better tools, but there aren’t very many stick, a stack trace.
And this is typical contention example. What you’ll see is you see that I’ve chosen two of the threads that are blocked. You can see the, just. They’re both. If you look at the headline of the name of the thread, they’re all active MQ ones. I don’t know if anyone uses that there’s two they’re are blocked and they’re blocked and it tells you what the lock is that they’re blocked on.
Serialized access
And then there’s a third one down there that holds the lock. Okay. Um, in this example, actually it was a production example and there were. Something like 30 threads, 30 active MQ threads, all, all blocked on, on one that was running. It’s not, so it’s not one thread that’s consistently running that lock is changing over it.
So it’s not going to block everything. What it is, is it serializing the execution across all those threads because only one of them at a time can progress. Okay. That’s a very standard contention example. That’s exactly the kind of example do you want to identify? And you can find out if I very easily from the stack trace, you can find out what is actually doing the lock.
And it’s quite easy to then say, okay, I need to change that Bach. So a way back, I gave you the slide with the top common problems and what I’ve tried to give you is an understanding of. What is achievable. Okay. That’s the first thing you need to understand, because if you’ve got a problem you need to know, is it, am I trying to do something that’s achievable?
Okay. That was that first section, because if it’s not achievable, you need to know that upfront is something that’s not achievable. I need to put a huge amount of effort, time, and money into doing that. Or I have to change my. Achievement my, what I can tell the business. So is it achievable? Okay. Most things are achievable.
Only those outliers are difficult. So then once it’s achievable, you just need to say, okay, so I’ve got a problem. I just need to set a target. What is, what is it that I’m required to achieve for our system? That’s the second step. And the third step is I have a problem. Let me identify the problem. Let me find out what’s causing it.
These are the tools that will let you do almost all the common problems. There’s not that many tools and there aren’t that many techniques and a little bit of practice will get you there, but even without practice, you can use these tools quite straightforwardly. Okay. And then these are the top common problems that people have announced, and those are the tools that apply for them.
And I’m going to leave it on that slide because the next one is just asking if there’s any questions .

Here are some additional videos and articles of mine (Cameron McKenzie) about Java Mission Control and Java Flight Recorder: