Introduction to Java Flight Recorder
The idea behind what we’re going to talk about today is to, to help you understand what it is that you can do with these two new open source tools called flight recorder and mission control. Now these tools have been around for awhile. We’ll explain where they came from, what the background is and so on, but it’s only more recently that they become part of the open JDK open source project.
And what that’s allowed us to do is all to do is to take the code and backport it. So that people who use it with JDK eight, as well as with JDK 11, Now, what I’d like to do to begin with is to run a little poll of the people who are attending the webinar. And so I have a question which I’d like to ask you, which is how do you monitor your Java applications?
How to monitor Java applications
I’ve given you four answers to this first is that you use commercial application, performance, monitoring tools, things like new Relic, things like app dynamics, things like, Those types of tools. And, the second one second option is that you use open source tools. So things like, visual VM, those types of things.
And the third option is that you use things that are built into the IDE. So intelligence has these kinds of things that beans has them. Eclipse has them where you can monitor virtual machines with those. And the fourth option is, well, why do we need to monitor our JVM at all? Okay. So I’ve given people a few seconds.
So if we. Click on the results. And if we can show the results to see what people have said, then hopefully yes, there we go. Right. So what we see is that about 15% of the people are using commercial tools. Interestingly, the majority of people here over half of them are using open source tools. And then we’ve got a few people, very few people who are using the IDE as interestingly, nearly a quarter of people, not quite sure why they want to monitor their JVM.
So. Flee the rest of the presentation. We’ll explain what you can do and how it is that you can get interesting information from the JVM about what your application is actually. Right. Okay. So let’s do talk a little bit about the history of where flight recorder and mission control came from. Now.
They’ve been around for quite a long time, and they were originally developed by the J rocket team and the J rocket team were a team that developed, not just at the. Flight recorder and mission control, tools, but also a virtual machine. And this is what Oracle acquired, through the BA acquisition.
Why Java Flight Recorder?
And so they acquired all of this technology at the same time. And really the idea behind flight recorder and mission control was to help in the development of the JVM itself because the developers need to understand, well, what is the JVM doing? Where are the places where there might be issues in terms of performance?
So they needed some kind of tool to look at that what they discovered was that. By doing that, they could also get a lot of information about how the application that was running on top of the JVM was also performing now. Clearly Oracle acquired sun Microsystems, back in 2010. And at that point they rebranded flight recorder, mission control, and then they literally just added the word Java in front of them.
So we’ve got Java flight recorder, Java, Mission control more recently, what Oracle have decided to do is to contribute this as. Open source to the open JDK project prior to open JDK 11, these were available in the Oracle JDK, but they were commercial features and that meant you needed to switch them on explicitly.
And if you wanted to use them for development and protesting, that was okay. They were free. But if you wanted to use them in production, then you would need a commercial license for that part of what Oracle has done. More recently in terms of JDK 11 is to have convergence between the Oracle JDK and the open JDK.
Half of that was removing certain features. Things like the browser plugin, things like Java web start. But also what they’ve done is taken a lot of these commercial features as flight recorder, mission control, application, class day sharing, and contributed them to the open JDK project. So now functionally, there’s no difference between what you would get as the Oracle JDK and what you get.
If you build the open JDK source code. Part of what they did with that is they also rebranded them because Oracle have the, the Java of trademark and they’re very protective of that. And they decided that rather than calling them Java flight recorder and Java mission control, we now start calling JDK flight recorder and JD mission control.
So that’s, that’s really the history of them, what we’ve done at as always. Let’s take the open source version in Jedi K 11 and back port it into JDK eight so that you can still use them with the Zulu JDK that I’ll talk about at the end and use those on a JDK eight application without any problems and without needing a commercial license.
Java JVM Flight Recorder and JDK Mission Control
Now, if we look at what flight recorder and mission control actually are and what they do, I put together this diagram to help you understand that essentially flight recorder is a way of, as the name would suggest recording or making available information about what is happening at a very low level within the JVM.
And what it’s also able to do is to give you information about other parts of the system. So you can look at what’s happening in terms of the application, you can see what classes do you have loaded for your application? How many objects are being created by the application code? that obviously relates to things like how frequently the garbage collector runs.
You can see what’s happening in terms of the methods that you’re using, which methods are being processed. By the just-in-time compiler, the JIT compiler, how long compilation of that code is taking. When that code is no longer being required. And when it actually gets flushed from the cash, those types of things, obviously there’s lots of information about what’s happening in the JVM from point of view of the memory management system, how objects are allocated when garbage collection runs, how threads are being managed.
So you can also get a lot of information about the state of the individual threads in both the application and the JVM itself. You can see. Whether they’re running, whether they’re sleeping, whether they’re ready to run all of those types of things. And then you can even get information at a sort of superficial level about the operating system.
And you can see which version of the operating system you’re using, what environment parameters of being set, things like that. The information that the flight recorder gathers can be handled in one of two ways. Now, if you want to, you can create a recording of that and write it to disk. So you can create a file, which contains all of the information.
Alternatively, you can take that information in effectively real time. As the application is running, as the JVM is doing its work, and you can feed that into mission control. And Mission control, as you can see, can either take the live data from flight recorder, or it can read the information from a previous recording.
Visual Java Profiler
What mission control is all about is allowing you to take that information and create a visual representation so that you can see exactly what’s going on. And I’ll. Do a demonstration of mission control a little bit later on, so you can see the types of things that you can do. So mission control is all about saying, okay, let’s take that information and make it usable in a way that people can look at it.
Yeah. Ron time to process lots and lots of individual pieces of data and lots of numbers and things like that. It’s about saying, okay, show me a picture, which shows here’s how the. Usage of the heat grew over time, his threads that were active at a particular time, what state were they in? All of those things are, I’ll show you as we go through the demonstration.
So clearly, as you can see, we have the ability to either use flight recorder as the application is running, or we can create a recording and then later, so let’s talk a little, a bit more detail about flight recorder and what it does and how it works. So the first thing is, is the basics of flight recorder.
Profiling with Java Flight Recorder
And what flight recorder is, is all about is, or as I’ve already explained to some degree is profiling an event collection. And it’s about getting the information that’s right at the low level of the JVM. Okay. A lot of tools, interface with the JVM, through the Java of management extensions, and they’re able to get certain pieces of information, but flight recorder, because it’s built into the JVM is able to use the very low level information that is actually gathered by the JVM itself in order to do its own work.
So really we’re just leveraging the collection of data that is already happening within the JVM to make that information available externally. That’s very important because it enables us to do a certain number of things. one of the things that often is a problem. With having tools that analyze how an application is working is you get what’s called the observability effect.
And to use my very early background, I did physics at university and you probably know there’s a thing called the Heisenberg’s uncertainty principle. Heisenberg’s uncertainty principle says the act of observing something changes, what you’re observing now. That’s really talking about quantum mechanics and when you observe very small particles, but it also actually applies to computer software.
What can happen is that in order to gather information about what’s happening in application, you have to instrument it. And instrumentation is where you add extra pieces of code that. Enable you to get events and get information about what is happening. Good example of that is if you wanted to instrument your code, you could say, okay, every time I enter a method, I’m going to send a message to say that I’ve entered that method.
Every time I leave a method, I’m going to send a message to say that I’ve left that method by collecting that and looking at the timestamps associated with that, you could see how long you were in a method. But the problem with that is that you’ve got overhead in the sense that you have to send a message for each entry and exit to a method.
And what that can do is distort the way that the application actually works. That can be quite extreme in certain situations. And I’ve certainly been involved in things where. What’s happened is that by adding instrumentation and adding debug information to an application, you actually changed the way it behaves so much that you lose the problem that you’re trying to solve.
that can be really, frustrating at times, but, What the idea behind flight recorders is not have that problem. So typically the overhead that you will get associated with using flight recorder over not using flight recorder is less than 1%. Flight recorder is very much. Designed to work with long running applications.
If you’ve got a short-lived application, then you may find that the overhead is a little bit higher because of the way that the warm-up works in the JPM and things like that. But if you’re running a server application that runs for hours, Days weeks, even then very much, you will find that the overhead will be less than 1%.
The good thing about that is it means it’s very much safe to run in a production environment and you can have flight recorder available. You don’t have to have it enabled all the time, but when you need the information, you think, okay, there’s a performance issue with my application. I need to gather more information.
You can actually go in dynamically. You can turn on the flight recorder, recording. Side of things, you can dump information and gather the information that you need, but definitely working in a production environment
Zulu Java Flight Recorder
in terms of how we control troll and flight recorder. We have a number of command line flags that we can use when we start up the JVM. Now, by default, if you’re using. Hmm, JDK 11. Or if you’re using Zulu JDK eight, then flight recorder will be on by default. So you don’t actually have to do anything to make it available.
If you don’t want it there, then you can turn it off explicitly. You can use the minus X, X minus flight recorder flag, and that will turn it off. But assuming that you’re going to use it, then you don’t have to turn it on explicitly. What you can then do is you can set certain parameters using these two other flags, the flight recorder options flag, and the star flight recording flag.
What that allows you to do is specify a set of option and value pairs, separated by comments. Now the way this works has changed a little bit. If you’re used to using the flight recorder on JDK eight, the Oracle JDK eight, then you would only have used the flight recorder options flag in JDK 11. For some reason, they’ve moved some of the options to the start flight recording.
Flag. And so you need to figure out which ones you’re actually going to use for Zulu JDK eight, because we back ported from JDK 11. It will use the stop flight recording flag rather than flight record options all the time. As an example here, I’ve shown how we can do that. So we start our application, we say start flight recording, and we can specify that we want to dump all of the information that’s collected by the flight recorder when the application exits.
And we also want to say where we want to put that information. So the file name is going to be in slash temp, dumped dock Jafar. And then we run our advocate patient. When the application finishes file will be generated with all of the data. That that was collected by the flight recorder, during the run of the application.
And there’s, there’s various other things that you can set using that. If you look at the documentation, you can find out all the, the various options that are available to you. Now, the way that recording of data works is that you can either do it. In a continuous way, or you can do it over a fixed time period.
And we talk a little bit about continuous recordings. The way that this works is again, in one of two ways you can say, I want to just simply Brite all the data that’s being generated straight desk, writes it straight to a file, but obviously that file is going to increase over time. And if you’re not.
Really interested in necessary all of the information that’s being collected. What you can do is say, okay, I don’t want to store everything out to desk on what will happen is that the JVM will only keep information in a buffer in memory. What that does is it uses a global buffer. So all of the information goes into a single buffer and it’s circular in the way that it works, which means that.
When it fills up the new data will start to overwrite the data at the beginning of the buffer. So it’s circular and old data gets overwritten. The size by default is actually seems quite small. It’s only 462 kilobytes. That still gives you the ability to write quite a lot of data. And if you want to, you can change the size of the global buffer size through the command line options and make that bigger.
If you want to, what you can then do is you can say at any point, if the information is doing, if the. Application is doing a continuous recording. At any point, you can say, give me a dump of the information that is in the buffer at the moment, or give me a dump of the information for the last five minutes, for example.
And again, I’ll give you a demonstration of that later on. In terms of the events that are recorded by the flight recorder, you can configure that at quite a fine granularity level as well. And there is a file which is called the default dot JFC file that is in. the lib JFR directory, depending on whether you’re using JDK eight or JDK 11, that’s slightly different in terms of where it is for JDK eight, it’ll be in Java home JRE, lib JFR, because the JDK 11 doesn’t have a separate JRE directory anymore.
It’s just in the Java home lip, JFR directory. If you look at that file, you find there are 131 different types of events that can be recorded. And there’s configuration that you can specify with that. And again, you can do that through the mission control. You don’t have to, it far manually can if you want, but you can use mission control to do that through a graphical interface as well.
Lots of different types of events. If you look at that, you will find out all the different things that you can see. And so. What that allows you to do is say, okay, I’m only interested in certain types of events. So let’s turn off some of the other ones that way we don’t have to record information that we’re not interested in.
We can just record the particular things that we want to look at. Or you can just say record everything and I’ll have a look at what’s going on.
In terms of interacting with the flight recorder, you can use mission control. You can use the command line flags when you start the application, but you can also use J command to interact with the JVM from the command line directly. So whilst the application is running, you can change things. You don’t have to do it through mission control.
So, if you want to do that, there are certain number of arguments you can specify. What I’ve shown here is the sort of basic operations is there’s more than this, but you can do things like J command. Then you specify the application. You’re interested in either by its name or by its process ID. And you can say in this case, Java flight recorder start, and that will start recording.
And, the. Flight recorder data. What that will return to you is a name, which is essentially just a number that you can use in terms of being able to dump information, because you can actually run multiple recordings at the same time. So if you want to have different configurations, you can do that. You can also say, okay, start with default recording.
True. Which means it will do continuous recording. If you want to grab information, as I said, you can generate a file directly. You can simply say dump name equals one, which is the number that you would have got when you started the recording. And again, you say what the file name is way you want to store the information that’s that’s being.
Recorded by flight recorder. And then when you want to stop the recording again, you can interact and you can say Jeff auto stop. So you have the ability to use online. You have the ability to use mission control. You can use the flags when you start up the JVs. It’s very flexible in terms of how you can use flight recorder.
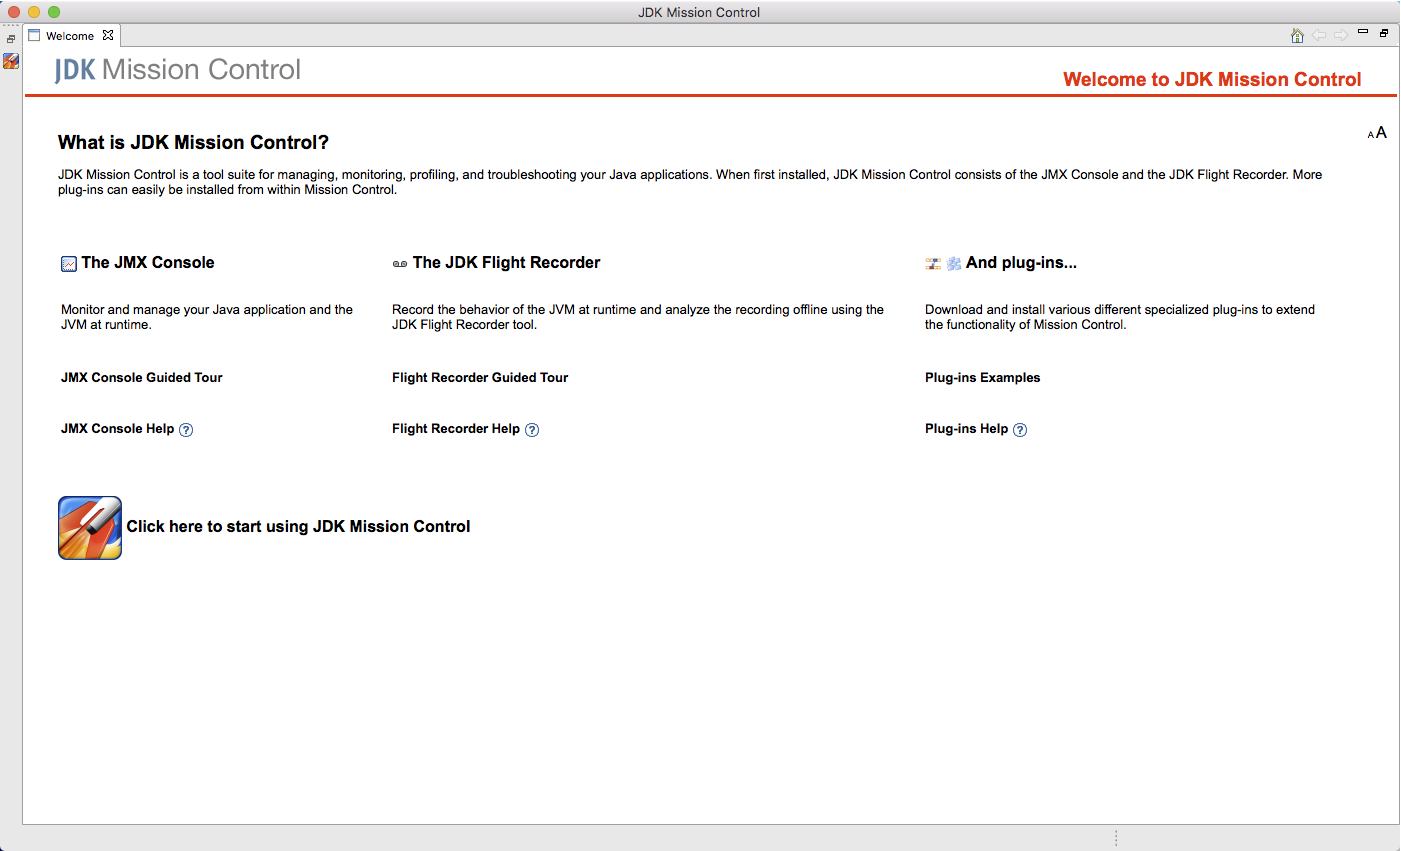
Okay, let’s talk a little bit about mission control because that’s the other piece which enables you to process the information that’s recorded by flight recorder, and then start to get an idea of what’s actually happening in your application. If we look at the, the basics of mission control, as I’ve already said, it’s really a way of analyzing the data that’s recorded by the flight recorder.
What you have is essentially a to start off with you have a browser for all the JVMs that you might want to interact with that will pick up on any JVMs that are running on the machine. Mission control is running on, but you can also connect to a remote JVM. If you want to over a network connection.
We’ll talk about that in a moment. The. Essentially the idea is that you can use the JMX console in order to interact with the JVMs. You can start recordings, you can stop recordings, you can set up continuous recordings. You can do dumps from a continuous recording. Many of the things that we’ve already discussed can be done through the mission control interface in terms of deciding when and how you want to gather the data.
Look at a simple example of the JAMEX console. Again, I’m going to show you the demonstration a little bit later on. So I won’t talk about this in too much detail, but this shows how the browser works and. On the machine that I took the screenshot on, you can see that I had net beans running. Yes, I am still a net beans user.
And then I have my application called loaded up main running, and that I have mission control running mission control runs on top of JVM. So obviously it picked itself up from the point of view of the net beans. As you can see there. It says flight recorded last attempt failed. when I was running that beans, I thought to myself, what, well, maybe I’ll try and see if I can actually, gather some information from that beans.
But I hadn’t realized that the version of the JDK that I was using was the Oracle JDK. And I hadn’t turned on the commercial features. So flight recorder wasn’t available by default. Because the loaded or main application that was running was on top of Zulu JDK that had the flight recorder turned on by default.
So there was no issue with that. Similarly, the mission control was running on top of the zoom JDK. And so there was no issue with that. But what we can do is we can use that too, as I say, set up various things into terms of how we want to interact with those JPMs we can collect a remote JVMs. We can turn things on, turn things off and stop.
In terms of remote connection. If you want to gather information from, let’s say something running on a server or something running in the cloud, then you do need to configure that JVM to enable mission control, to interact with it. There are a couple of things you need to do at the minimum. You need to configure a specific IP port that mission control can talk to on that IP address.
In this case, I’ve used the default, which is 7,091. Also for the purposes of the demonstration that I’m going to show you. I turned off authentication and I turned off the use of SSL. I wouldn’t recommend doing that in a production environment. If you’re running in a production environment, you can use.
Authentication. so you can set up the connection with a password username and you can set up SSL connections as well. So these are things that you can do to simplify if you’re running in a controlled environment. The other thing I found that, if you’re running on a Linux system in order for this to work, the host file.
Oh, has to include the actual IP address of the machine that’s running. The machine I’ve got here in my office has a bunch of running on it. And when you look at the host file, the host name is given with a local host IP address. So you have to change that to the right IP address that you would normally connect to across the network.
And then everything. Thing will work. What you get. If you connect to a running JVM, you can do live monitoring. And again, I’ll show you this on the demonstration. So this is just a screenshot to give you an idea of what, what type of thing you’re going to see. Obviously the, the immediate information you could see as the sort of simplistic data about how much heat is being used, how much CPU is being used.
And then you can get some information about the size of your live sets and the fragmentation that’s being. Observed within the heap. And then you also get a timeline here at the some way. You can see how things are changing over time in the last sort of couple of minutes. And there’s various other things that you can do with that.
You can show different things, but again, we’ll see that in the demonstration.
Flight Recorder & Mission Control Rules
Mission control rules. This is, this is very useful. It’s very powerful feature because often what you might want to do is to have a certain situation where you’d like to gather flight recorded data, but you don’t want to be doing that continuously. You also don’t want to do it on a timed basis, but what you want to do is have certain things trigger.
The recording of data. So a certain event happens that will start the recording of data, and then you can stop it so that you can analyze that data to see what happened in order to cause that this kind of things that you can see here is the standard rules and things like when CPU usage goes above a certain level, then you can start recording.
And that way you can sort of see, okay, We went above a certain level. What Royal threads doing, you know, was something happening that was unusual, that caused lots of threads to be created, or threads were very heavily used. Things like that. You can do, situations where you’ve got deadlocked threads. So you can analyze that.
You can look at the live data being live set, becoming too large. even the thread count becoming too high, things like that. Those are standard rules, but you can also create your own rules as well. So if those ones don’t quite fit, what you’re trying to do, then you can create your own rule. That’s specific to your situation with a rule, you can then specify not just the conditions associated with that in terms of like what percentage of CPU utilization is going to trigger this recording, but you can also say what action you want to happen when that rule gets triggered.
In terms of the things that can happen. Obviously you can dump a flight recording, so you can look at the data afterwards, but you can also do things like sending somebody, an email, you can send output to the console, things like that. So it’s very flexible in terms of being able to configure what the rule does when something happens.
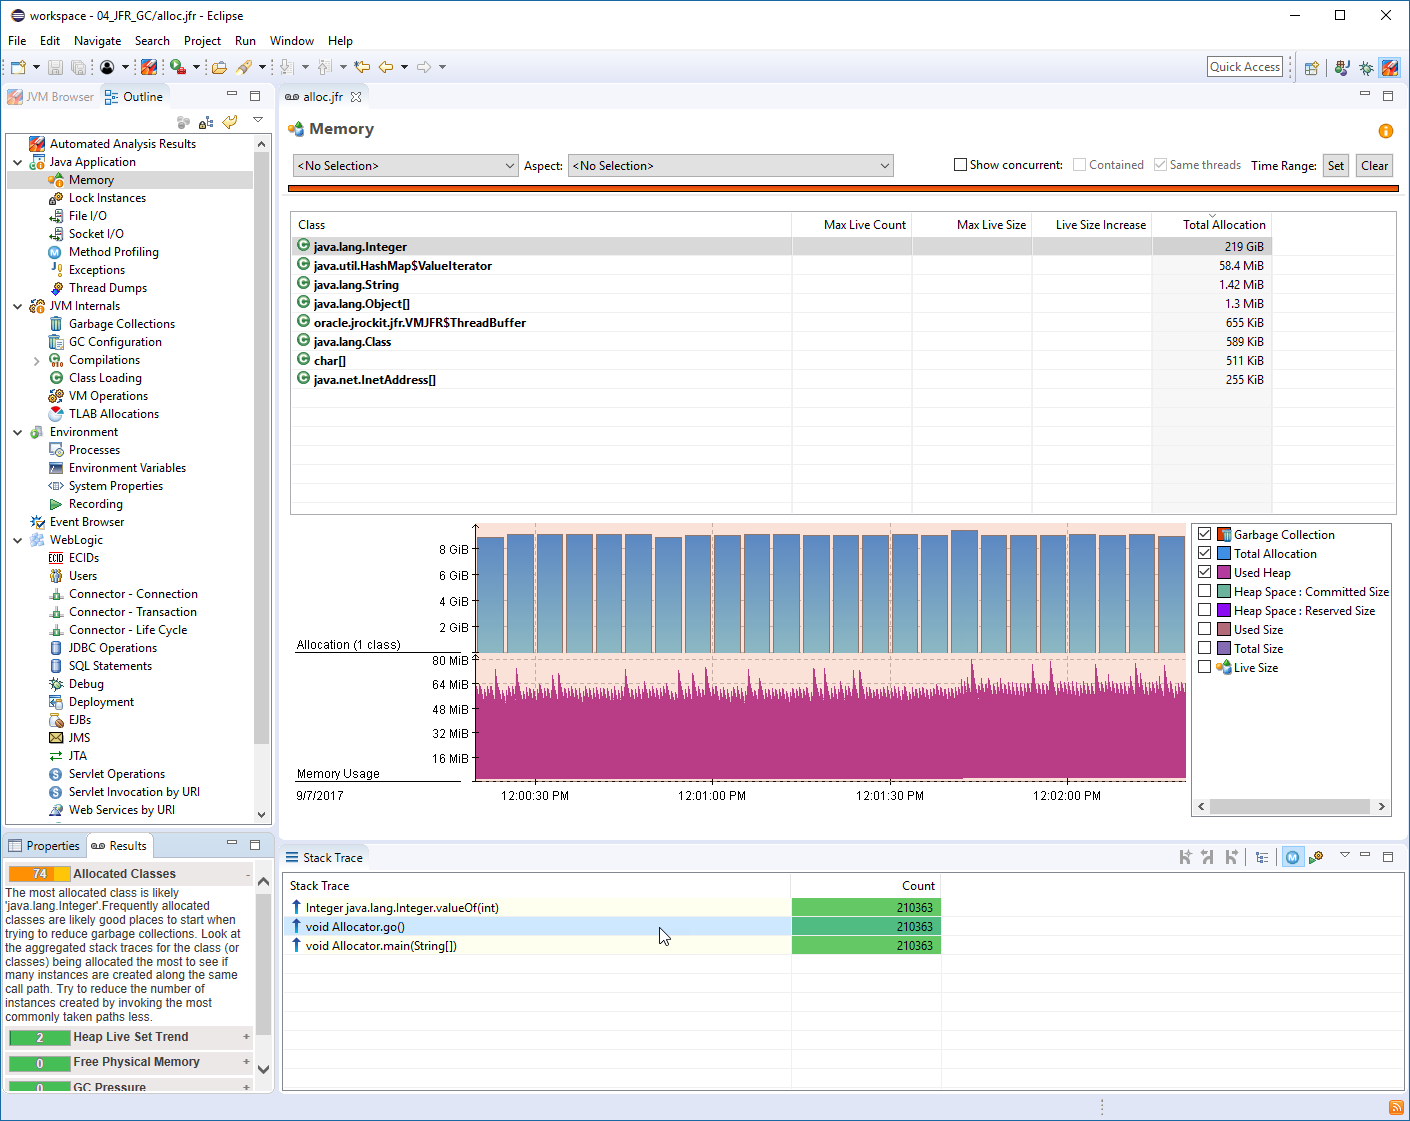
The data that you get from mission control. Because as I said, there’s 131 types of events that can be recorded by flight recorder. What you can do in terms of analyzing that is, is very comprehensive. So all the aspects that you would expect of the JBM behavior are being monitored. So you can see information about threads.
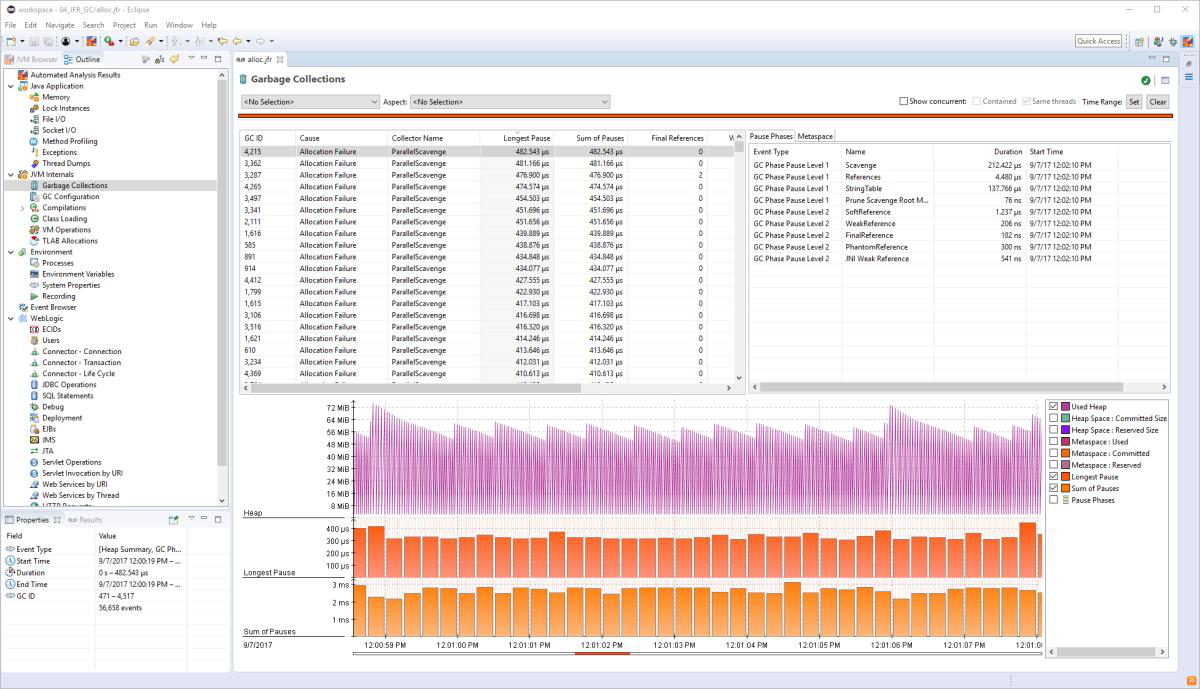
You can see information about the memory usage and the garbage collector lock instances, how the system is interacting through file IO, socket, IO, all of those types of things from the JVM internals point of view, you can see. Again, detailed information about the garbage collection, lot of information around the JIT compiler, because that’s a large part of what the JVM does.
Look at the code cash, what classes are loaded and things like that. And then again, as I said, even from the operating system environment, you can see things like the environment, variables, system properties, other processes that are running so very comprehensive set of information, which we’ll see in the demonstration later on.
Right. So quick summary of what we’ve talked about, that the important thing here is what I’ve said in terms of what we do at the zoo in terms of creating the Zulu JDK and the Zulu mission control is related to that. So what Zulu JDK is. Is that we take the source code of the open JDK, and then we build that using the standard scripts into a binary distribution.
Once we’ve done that, we run all of the TCK tests in order to verify that what we’ve created does conform to the Java se specification. There’s no reason to expect it not to, but to be absolutely sure. We run all the tests make absolutely positive that we are complying with the standard. In terms of the versions that we support, we go all the way back to JDK six, we have seven, eight, nine, 10, and 11 available, and we have wide platform support.
We’ve got the. Normal 64 bit versions of windows, Linux, and Mac on the standard Intel architecture. We’ve also got 32 bit versions of those for windows and Linux, because we have some customers who are still running on older versions of the operating system and need a JDK that will work with that. And then we have arm 32 arm, 64 power PC, a MIPS versions.
If you’re looking to work on embedded applications. one thing I would say is at the moment, embedded at the embedded side of things, Zulu, does not support mission control on flight recorder. So only the Intel versions that do. From the point of view of Zulu mission control. As I say, what we’ve done is we’ve taken the open source version that was contributed to open JDK 11 and we back ported that.
So it works with the Zulu JDK eight. And what. That also means is that when you’re using mission control, it will work with any compatible JDK, Zulu JDK, eight degree, K Zulu, JDK 11, the Oracle JDK eight. If you turn on the commercial features and anything that’s built on top of open JDK, 11 bill have support for flight recorder built into it.
Just to sort of summarize again, the flight recorder of mission control aspects. as I say, flight recorder is a very powerful way of collecting data, not just about the JVM, but how the application is working on top of that JVM because of its very tight integration, low level with it. In the JPM it’s safe to use in production and doesn’t have a significant impact on performance.
Flight Recorder Performance Analysis
As I said, less than 1% typically, impact on performance. It’s very flexible in terms of how you can use it. You can use it from Mission and control. You can set things on the command line. You can use J command if you don’t want to use mission control, or if you want to do it through a command line.
Yeah. It’s another nice feature about this is if you’re using an application that’s been provided to you by an ISV, then you can say, okay, something’s maybe not working in quite the way I want it to in performance, you can use flight recorder, mission control. You can dump. , recording of how your application’s working on your machine and what it’s doing.
I mean, you can send it to your ISP and say, here’s the data they can use. Mission control. They can look at it, analyze what’s going on and identify if there’s something that needs to be done differently in terms of configuration. Yeah. To solve any performance problems in that way. Mission control. Very comprehensive analysis tool for taking flight recorded data.
And then being able to look at what’s going on either in running application or after the application stopped. And as I said, this is now available literally today. We’ve announced this as a download for Zulu JDK, right? So let’s look. At a demo and see how this works in practice. So what I’ve got here is the mission control.
Now at the moment, what we can see on the left-hand side is the JVM browser. And the first thing that I’m going to do is actually connect to a machine that I’ve got running in my office, which is running an application. That’s doing some, some work. So if I create a new connection and all I have to do is specify the IP address.
I’ve got the port set up. As I said, when I started the application on my other machine, I set up the necessary JMX parameters so that I could connect to that. And hopefully if I test the connection, then it says status. Okay. That’s pretty reassuring. It’s nice to see that my demo works. It doesn’t always happen that way, but it’s good to see that that works.
So if we finish, what we’ll see now is that we’ve got ten.zero.zero.one. And we’ve got a flight recorder there, which no recordings. Now what I can do here is say, okay, let’s. Start the JMX console, and that’s going to connect to the flight recorder in that JVM across the network. And give me the live information about what’s happening on that machine.
So hopefully yes, there we go. We see that. We get the same display that I showed on the slide earlier. And now what we’re saying is information about the Java heap usage, and you’ll be able to see, depending on how quickly the, things refresh, you’ll be able to see that the memory is going up and down because I’ve set up the application to do a lot of object creation, some of the objects.
So, The references is being maintained. A lot of them being thrown away. So it makes the garbage collect to do some work. Also I’ve, I’ve maxed out pretty much the CPU by doing a lot of maths and things like that. So, just to sort of make it look like it’s doing something, the, the application itself is completely useless.
Doesn’t really do anything useful. It’s just designed to show how flight recorder can work. And then again, we’ve got information about flight set, a live set, and fragmentation. And as we can see, we’ve got a little graph here that shows the, usage. So we’re seeing in terms of memory, very typical garbage collection cycles, where it’s hitting a minor GC reclaiming a lot of space from the young generation, which reduces heap usage.
And then it gradually goes up again. Yeah. So that’s the kind of thing that we can see. We are on a running system. I won’t go into lots of the other. Tabs that you can look at because we look at those in terms of other things. But what I can also do is I can say to, I could say, okay, let’s create a recording of this machine doing some work.
So if I select a recording, what I’m going to say is rather than selecting a minute, because you don’t want to sit here and watch me just. Have a minute’s worth of data being recorded. Let’s record 10 seconds. So record the last 10 seconds of the application. And then what we’ll see here is that it’s displaying, how many seconds are remaining.
Start Java Flight Recorder
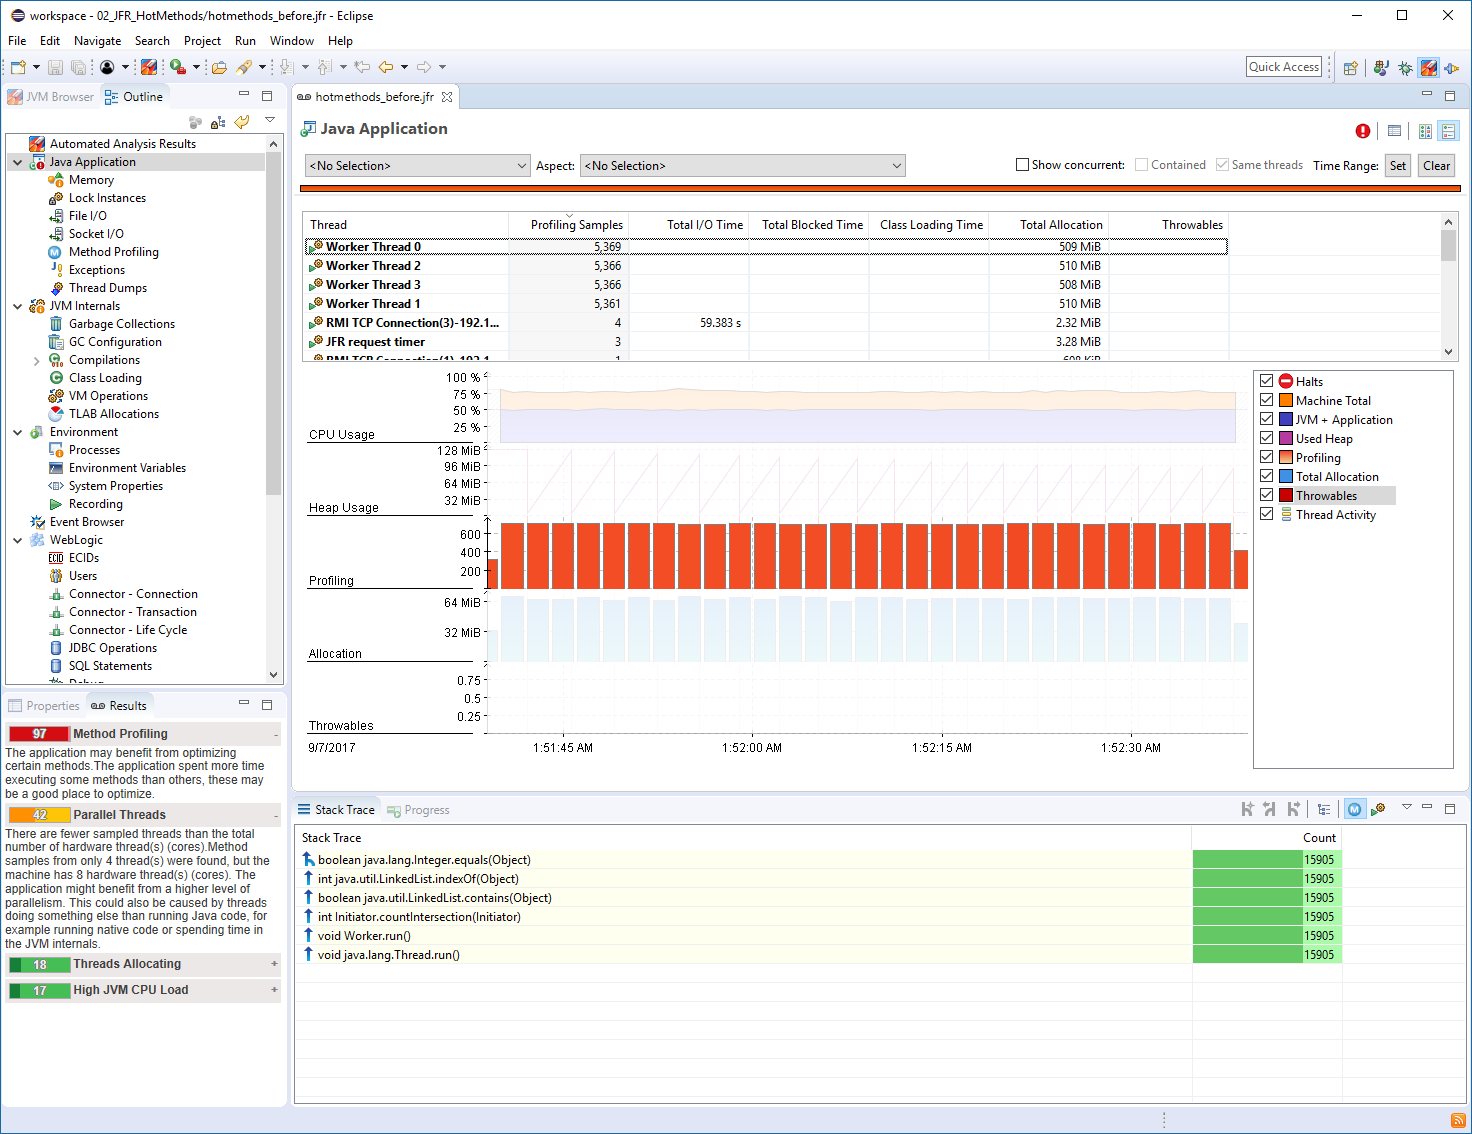
It’s recording the data and after 10 seconds, it will. Save the data and it will open it up. Now, the first thing we do is we now switch to the outline. And the first thing at the top here is that we’ve got an automated analysis where the mission control tool is actually looking at all the data that’s being collected.
And trying to identify if there are any obvious things that you might need to be aware of. And in this case, there’s not a lot of things that are happening because it’s a very simple application, but there’s maybe some flight recorder settings that that might, but we’re seeing some other things in this later on, but we’ve also got, is to look at what’s going on in our application so we can see here.
If I switched to this display, we’ve got, all the threads that are happening in our application over that 10 seconds of data that’s being recorded. If I pick one of those threads here, what I will see is this is my memory loader thread that I wrote, and I can also select a portion of time in there to zoom in on.
And now what I can see is how that thread is actually working. And I can see that for some of the time it’s asleep. So it’s sleeping for a hundred milliseconds, excuse me. And then it doesn’t work. And then it goes back to sleep for a hundred milliseconds and does more work. And does that continue late?
If I look at another thread, it’s not a very interesting one. let’s go back to. The I is. Yeah. So we, we, we’ve got all sorts of different threads and we can see what things are happening here. So we’ve got that thread is doing some compilation, so it tells us that there’s compilation going on, pulling enough in the compiler thread, you’d expect that.
All sorts of things happening that most of the threads are not, not doing anything terribly exciting. , again, if you want to look at memory, we can see that we’ve got the typical garbage collection cycles here where the usage of the heap is going up. Then dropping back down again, as we do the garbage collection.
The other thing that I would show on this one is socket IO. And so there’s a connection here where we’re sending a lot of port packets across network. In this case, all what’s happening is that the application is sending messages to mission control. So we’re not really seeing any activity other than the data that’s being sent to the mission control.
That’s monitoring it. If we were using an application that was maybe a microservice architecture, where you had connections to other, services that were happening over a network connection, then you could analyze things here. You could see how much data was being moved around and things like that. So that’s, looking at that kind of information.
If we go back to the browser, as I said, the, the virtual machine that’s running, the mission control is also. Able to collect data. And in this case, if we look at the flight recorder, that’s running a continuous recording of mission control, or actually doing its work, what we can do there is we can actually say, okay, let’s dump some recording data from.
Java Flight Recorder Analysis
Was that continuous recording. This is where we might have a situation where suddenly something changes in our application and an event happens. We got, Oh, it’d be really useful to look at the last five minutes of data for this application. Let’s grab that. So we’ll, we’ll grab that. And then again, what it’s doing is it’s saying, okay, take that data.
Do some analysis on it and show us whether anything is happening in this case. What we’re seeing is that a lot of the physical free memory is being used. So my laptop is doing a lot of work. So we’re using quite a lot of physical memory. There’s also some issues around socket reads. That’s because of all the networking that we’re doing because of the fact.
https://youtu.be/7z_R2Aq-Fl8?t=894

Here are some additional videos and articles of mine (Cameron McKenzie) about Java Mission Control and Java Flight Recorder: