Profile a JVM with Java Mission Control
hey i’m cameron mckenzie at cameron mcnz on twitter and i wanted to talk about java latency and specifically how we can detect java latency using java flight recorder and jdk mission control and furthermore how we can battle that java latency with a few little performance enhancements to our java code i want to talk a little bit about java latencies and troubleshooting java latencies with java mission control and java flight recorder got a little application here that has a logger in it the class is named latencies it’s from marcus hertz suite of examples for java mission control it’s got a little main method here and i’m going to run this main method and as i run this main method i’m going to have java flight recorder maintain metrics on what’s going on so i right click i say run as a java application with auto record enabled and all of a sudden this will go through and start recording some work as these different java threads start doing some processing now just mentioning the auto launch i do have this file called latencies auto record launch and there’s a string attribute here for vm arguments and all we’ve done is set flight recorder up and specified that the flight recorder would start two seconds after the application starts and would go on for 60 seconds that’s how we actually kick flight recorder off right away as soon as the application starts well i think it’s been running long enough i’m going to click enter here to terminate the program that will create a flight recorder recording in this recordings folder i think that’s saying the word recording is long enough i do a little refresh there open up the latencies file java mission control will process the java flight recorder recording and you can see right here it’s identified a problem java blocking threads in the application were blocked on locks for a total of 36 seconds but i don’t even think it was running that long the most blocking monitor class was logger so it looks like we know where our problem is we know where the offending class is but even though we might know right away
CPU Profiling with Java Flight Recorder
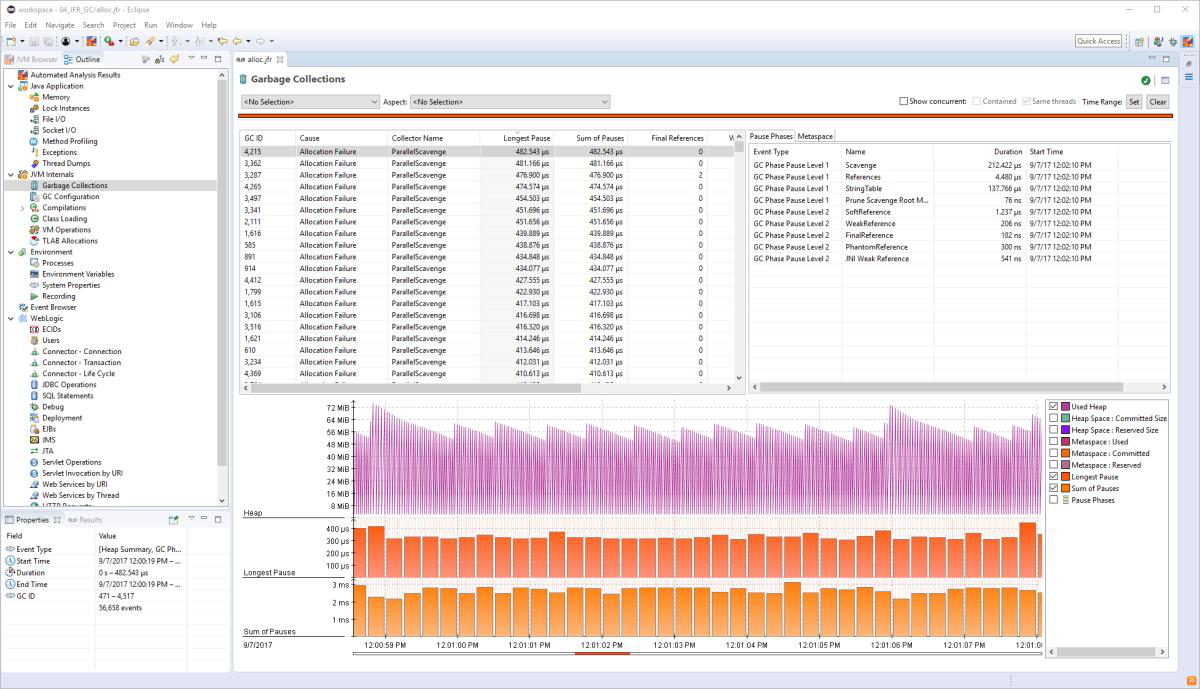
let’s go take a look and see what is happening here dig a little bit deeper in our application and you can see cpu said q usage was pretty high but that just means when one thread is blocked another threat is going so that’s not necessarily great we can see the worker run there we did get a message saying that we had problems with locks so it would make sense to go look at lock instances here and you can see definitely there were a number of locks it looks like as we were trying to get that monitor address we ended up with hundreds and hundreds of different blocks happening for quite a bit of time and we can even come down here and see that you know what the method that was causing this problem was that logger method so i think we’ve identified the problem we should be able to go into logger look at that log method you can see it’s synchronized synchronized methods in java always have a performance hit i don’t think we need to synchronize access to the log method so i’m going to comment out synchronize and i’m going to start this application again but i do want to do a visualization of these threads and get a good visualization of the blocking i’m back in the java application tab of java mission control and i’m going to look at all these worker threads and i’m going to highlight them and as i highlight them you’ll see this salmon color come up in the display of how these are running and each of these little salmon colors here are problems with the our problems with locks happening in our code so every time that salmon color appears we’re getting some form of blockage and it we may have only one thread running at a time if everybody else is blocked trying to gain access to that method
Visualize Java Latency with Mission Control
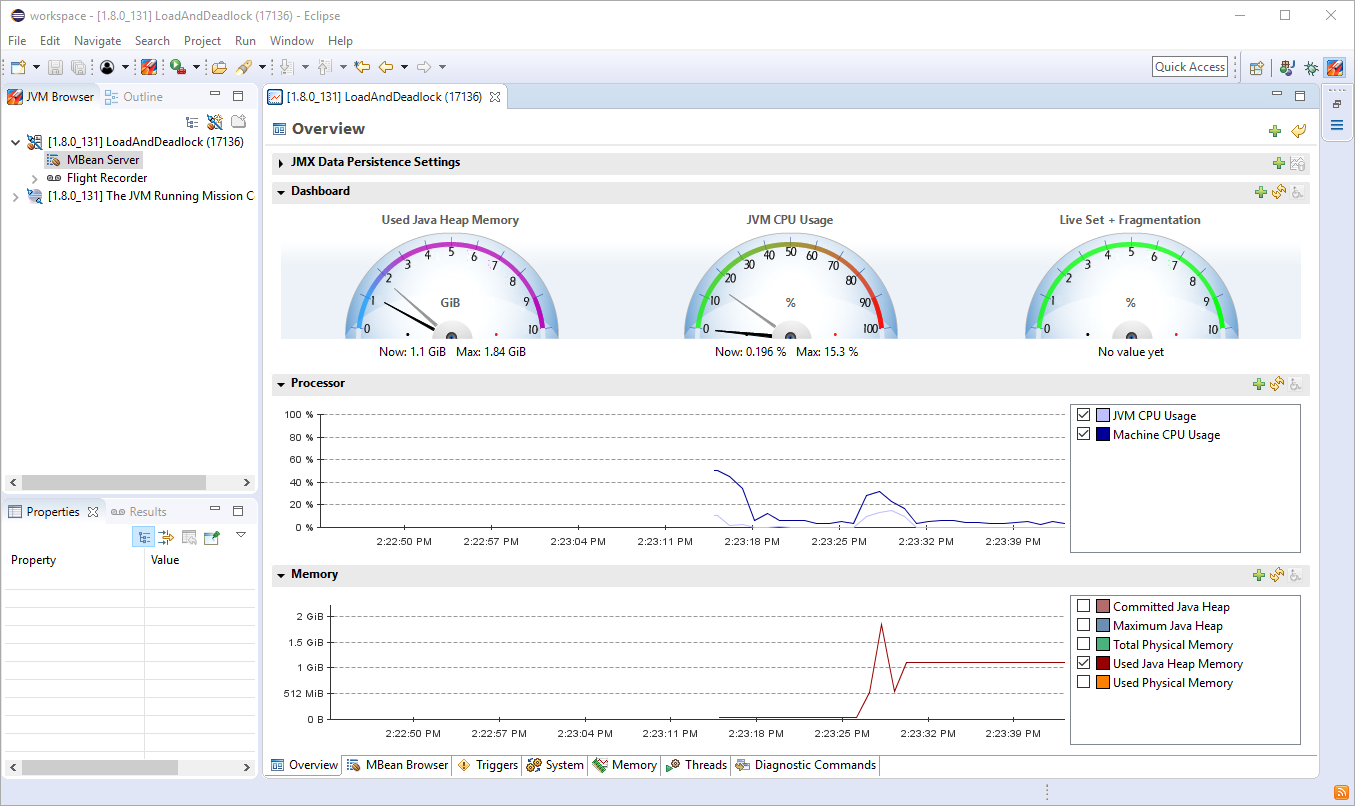
And so that’s what our visually what our application looks like and this is what’s causing all of the latency that salmon color in there okay well why don’t we run the application again now that i’ve taken that synchronized keyword out i’m going to change the launch a little bit and what i’m going to do is i’m going to just add the number 2 to the name latency and so now when this runs i’ll get a second file created and we’ll be able to take a look at that second file side by side with the first file so i’ll go back to latencies.java run the java latencies troubleshooting example use the auto record launch for eclipse and allow this to just run for a minute or two and i know i said a minute or two but that’s enough for me so i’m going to click enter over here i’ll go back to the package explorer i notice that in recordings nothing’s there but when i click refresh i get latency 2 and this will open up and remember before when we first did our monitoring the analysis said there was a lot of java blocking going on if we actually take a look at the new file you’ll notice that it doesn’t say that anymore it says there was a couple of errors in there i think that was just when i stopped the program so i got some background processes running and we’re using the cpu quite a bit so high jvm cpu load but i don’t think that’s an issue we’ve got lots of threads running and they’re doing lots of processing
Java profiling success with JFR & JMC
the other thing that’s neat is just going into well we look lock instances so we don’t have anything showing up on the locks anymore but if we go into the java application if you do that color coding of all of the different threads that are running you’ll notice that we don’t have any of that salmon color anymore so previously we had all of that salmon let’s bring that up you can see salmon salmon salmon salmon it’s like it’s like a river in the fall um over here we don’t have any of that salmon color so we’re doing processing we’ve got our worker doing processing we’ve got our worker nothing like we had over here with all of these blocks and there you go that’s how you can identify java latency issues with java flight recorder and java mission control and that’s how you can then go in troubleshoot change your code reevaluate and hopefully you will fix your java performance and latency problems and there you go that’s how you battle java latency in your applications with java flight recorder and jdk mission control now if you enjoyed that tutorial why don’t you head over to the server side.com we’ve got lots of great tutorials on java mission control java performance java troubleshooting enterprise software development in general you name it if you interest my personal antics you can always follow me on twitter cameronmcnz and subscribe on the youtube

Here are some additional videos and articles of mine (Cameron McKenzie) about Java Mission Control and Java Flight Recorder: