Java Flight Recorder Example
hey I’m cameron mckenzie @cameronmcnz on twitter and I want to show you how to use java flight recorder and java mission control to do some performance evaluation and in this case i want to show you the difference between a hash set and a linked list when you’ve got a large number of elements in your java collection i want to show you the difference in performance between a linked list versus a hash set by using an example based on marcus hertz java mission control java flight recorder examples now in this example what I do is basically I create two collections the first bunch is a bunch of numbers the second bunch is a bunch of numbers the first bunch is all of the numbers between one and a hundred thousand that when you mod it by the number three there’s a remainder so I guess what that puts in 60 000 numbers and then the other one is every number between one and a hundred thousand that has a remainder when you mod it by the number two that’s the basic method that initializes it and then once we’ve got those two collections of numbers that are links lists initialized we want to find the intersection we want to find how many numbers in the first list are the same as the numbers in that second list so we go through them one at a time we check to see if you know the number in the first list matches a number in that second collection that’s the idea of the example here causes a lot of computation and I’m going to run this with flight recorder and take a look at how the cpu and memory behaves now one thing I do want to point out this this kicks off eight threads in my example
Custom Flight Recorder Events
and every time a thread kicks off i create a new work event and you can see the work event here this is from the java flight recorder jdk api I create a new worker called threadwork i started at the beginning of the run method so you see event.begin i terminate it at the end and this will help me keep track of how long it takes to actually run all of these methods but without any further ado let me run on my hot java method runner run as a java application I do have a launcher configured here which will automatically run java flight recorder as soon as this starts you can see some of the output being printed in the console and in just a moment you’ll actually see the number 33 333 come up as a an individual thread starts going through this process and figuring out how many cross sections intersections there are between these two lists so there you see the number 3333 getting printed out one two three four five six seven looks like eight times i want that to run one more time so i’ve got eight threads going on an infinite loop and once I see a second print out of those numbers it is taking a while for this to calculate once I see a second print out of most of those looks like those threads are all returning now
Start and Stop Java Flight Recorder
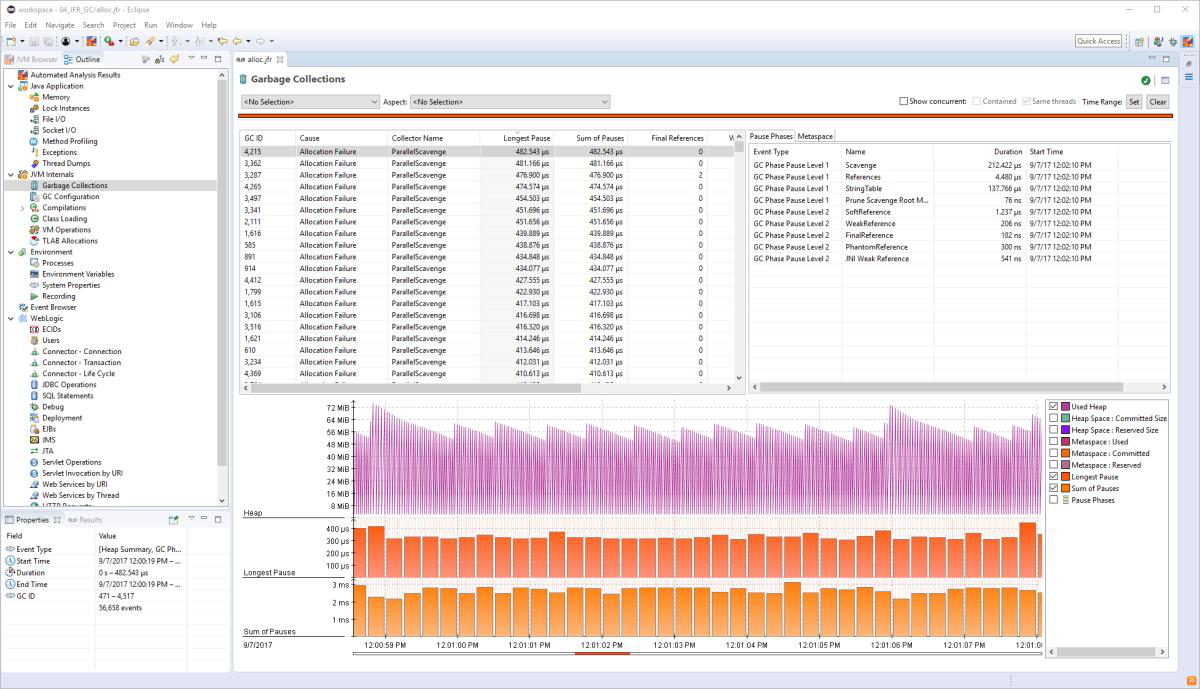
I’m going to click enter to terminate that program now i’ve told the program to save everything into a folder named recording so I’m going to do a refresh over here there you can see my hot methods there it’s going to do a bit of processing on the information that’s gathered now when i open up on the method profile and you can see it says whoa count matches is consuming 82.6 of the possible samples from this application and that that seems to be a real problem here i got a number of processes running i think that fatal error is just when i stopped the program but this certainly looks like a problem i want to be concerned with count matches is definitely an issue I want to get a little bit more information so i click on java application here you can look on the method profiling over here we can click on an individual method i can change the way this is laid out from a regular layout to a tree based layout i like the tree based layout and you can see here it’s saying you know when these threads run it looks like the integer.equals method is consuming about 76 percent of the the clock cycles that comes from a come out
Java Flight Recorder & JDK Mission Control
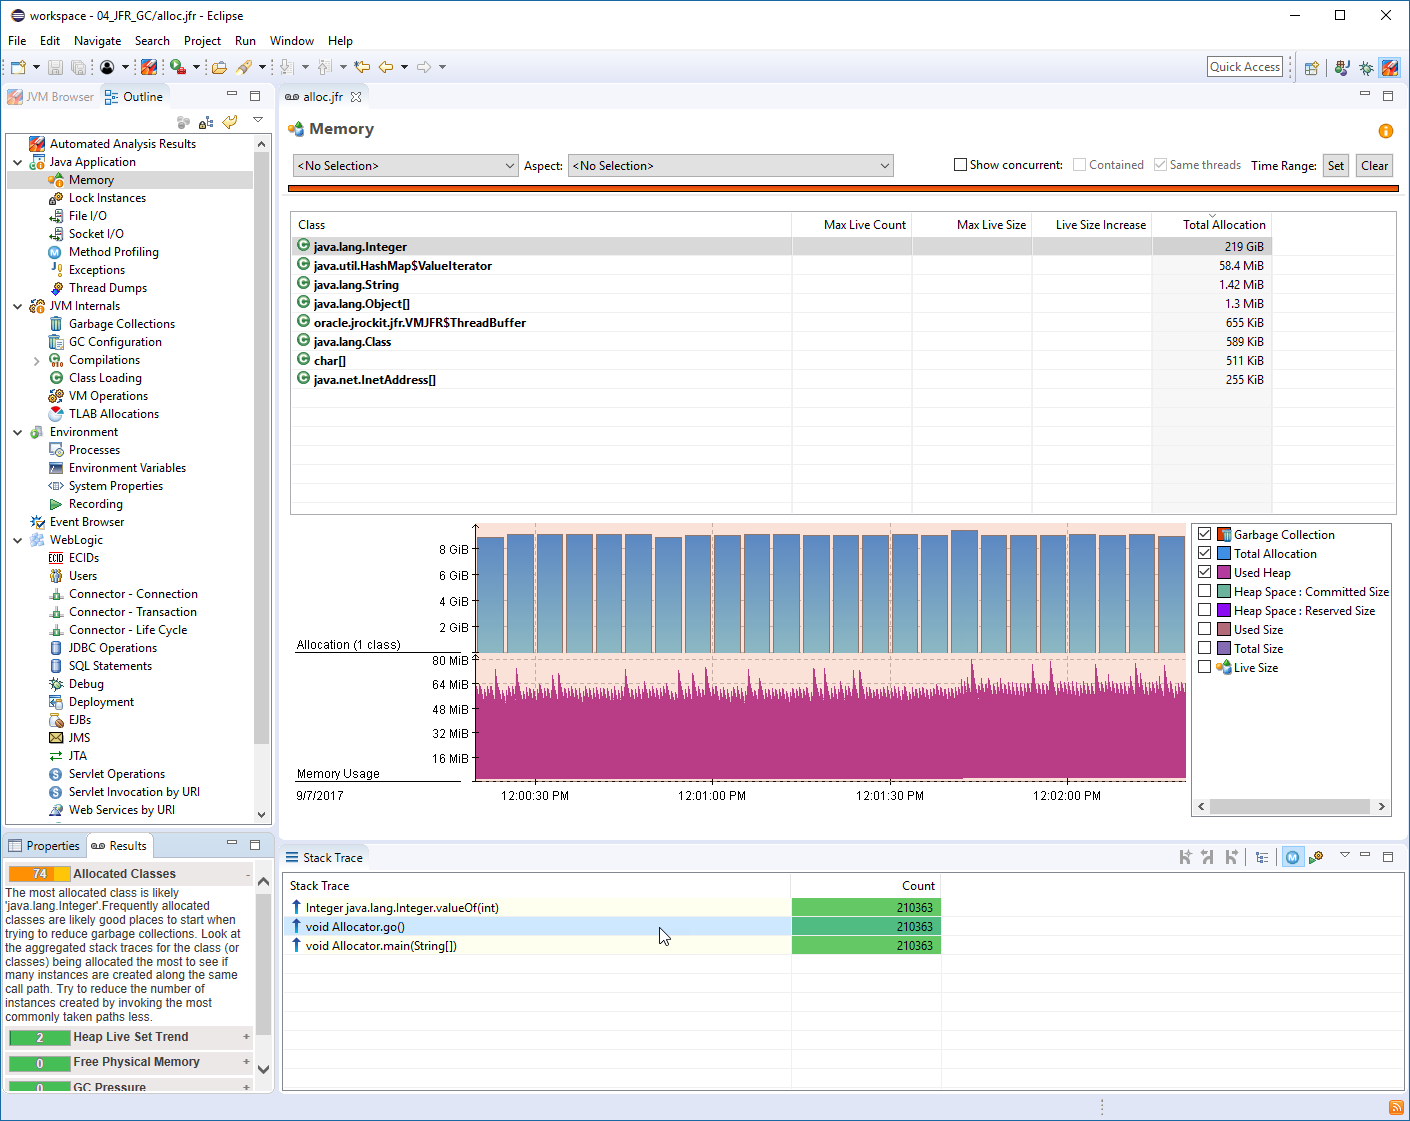
I’m going to click on a couple of the threads up here there’s worker thread 0 yeah we can see here that equals method which is eventually called by that method count matches in my hot java method class that’s taken 77 percent of the sample 77 of the clock cycle seem to be consumed by that now I don’t call that explicitly but i do call contains right here and that contains method is going to compare this I which is a lowercase i i think no it’s an uppercase I um that might be comparing no it’s comparing the interface so it’s not an unboxing issue it’s uh it looks like a genuine issue comparing things and pulling things out of that linked list up here so anyways interesting information another thing you can do here is I’m gonna i’ve got this special setting here i’ve said you know what I want that thread work object to be displayed in flight recorder that thread work object is that work event that I created right there there’s thread work and you can actually see that worker thread being displayed here and you can see that it says to me it took about 19 seconds to process that information look on one of these other threads and this one took about 19 seconds as well this one took 21 seconds through the processing so you’re looking at about 20 seconds to do the processing in this loop now watch this here’s the payoff pitch right here let’s make a little change instead of linked lists let’s use hash sets the linked list the larger the list the more difficult it is to process it and the bigger the performance uh implication hash sets tend to have linear performance so I’m going to rerun this I’m going to go to package explorer delete that hot methods jfr file javaflight recorder file I’m going to run this again run it as a java application and look at this like this is crazy previously it was taking 20 seconds to process this list now it looks like it’s going 20 times per second so I’m going to click enter in there to terminate that I’m going to take a look at the java flight recorder recording so i’ll do a refresh over here bring this into java flight recorder actually I got to close the old one because uh it’s just caching the old one there bring it into the new one and let’s see what it says it says uh well there’s a couple of application halts and maybe there was a high jvm cpu load but there was only a high cpu load there because my threads were running so quickly so it looks basically like everything was running really really well this time certainly if I do a comparison so let’s take a look at these java applications look at the comparisons of of how the threads ran here
Analysis with Flight Recorder Examlple
you can see there really is no comparison these processes were going lightning fast if I look at these individual threads you can see that geez it’s almost doesn’t even tell us it’s a 167 milliseconds in order for these processes to run if you look at thread work here and that one was as low 137 milliseconds 191 milliseconds 200 milliseconds there but as you can see that the difference is just unbelievable between using the hash set and the link list and we discover that by using java flight recorder and java mission control and there you go that’s the difference between hash sets and linked lists as far as performance goes and it was all demonstrated using java flight recorder and java mission control now if you enjoyed this tutorial I want you to head over to theserverside.com I’m the editor and chief over there lots of great tutorials on java performance devops you name it if you’re interested in my personal antics you can always follow me on twitter at cameronmcnz and subscribe on the youtube

Here are some additional videos and articles of mine (Cameron McKenzie) about Java Mission Control and Java Flight Recorder: