JVM Flight Recorder and Memory Leaks
Hey I’m Cameron McKenzie @cameronmcnz on twitter and i wanted to talk to you about java memory leaks and how to fix those java memory leaks and specifically how to do it without having to dump the jvm heap.
How do you do it? well you sprinkle in a little bit of java flight recorder a little bit of java mission control and hey your java memory leaks will be fixed now this example of how to find detect and fix java memory leaks without having to do a jvm heap dump picks up on marcus hurts jmc tutorial in which is a nice little application that well it creates a little hash table and that hash table gets a hundred things put into it and then it gets 100 things removed from it but he’s got a little sneaky little leak speed here which when it goes through the process of doing removal.
How to create a memory leak
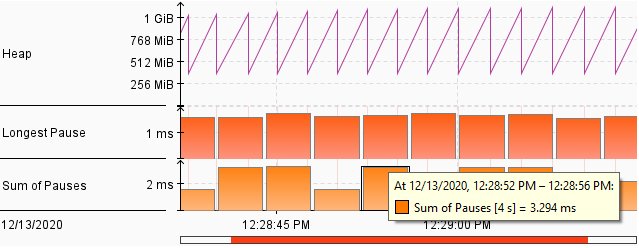
it may leave one or two things in there and you can see that leak speed is subtracted from the number of objects being removed which means this little hash table this little char array never gets completely empty and since it’s never completely empty it’s never garbage collected so anyways this application is a nice little example of an application that generates a leak when you run it you can just right click on it say run as java application and use the auto record feature which will trigger java flight recorder if you’re interested in how that happens it’s just a little setting here in the launch configuration that says hey run flight recorder and setting a couple of options in there as well anyways i’ve run this and this is what i got right away java mission control it reads the java flight recorder recording and it says hey there’s a big problem here with your heap size you need to free up some objects you need to deal with some leaks it says the live set on the heap seems to increase with a speed of about 192 kilobytes per second the analysis of the reference tree found one java memory leak candidate the main candidate is this hash table entry and so that’s pretty good start i mean that’s telling me right away you know i haven’t even opened up a java heap but this java mission control is telling me that there’s a problem inside of my jvm with this particular object that hash table and so i can go and grab a little bit more information but i click on outline over here
Memory Leaks in Java Mission Control
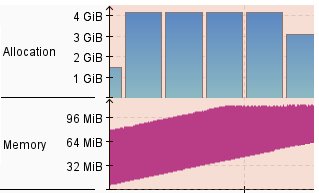
i can click on memory and wow definitely you can actually see that increase of memory going up over time and it seems like the garbage collector can’t even continue to collect all of the garbage because there’s so much stuff that it just can’t take out of memory so i’ve definitely got a problem here and you can see here that over time there’s been 16 gigs of data allocated to that char object so that seems pretty crazy as well now this isn’t the coolest feature of the whole java memory leak detection what’s really cool is this live object setting this java mission control live object setting what it does is it uses a new java flight recorder event that java flight recorder event is called the old object sample event and what it does is it goes into memory and it samples maybe 256 maybe 512 objects not every object in memory and it keeps track of when it was created when it was destroyed and also how much memory it’s consuming now the thing is as an object gets garbage collected a new object goes into that old object sample event cache and eventually if an object’s got a leak if an object is leaking it won’t be pulled out of there and if you allow this process to run over time.
Profile Memory Leaks with Java Flight Recorder
it’ll actually pick up all of the objects that are leaking and so you don’t even have to do a java heap dump you’ll be able to run this java flight recorder take a look at the live objects that are available in memory and you should be able to identify the objects that are problematic and it gives a good amount of information as well if you look at properties down here it gives you the duration the event thread that created it the garbage collection route the last known heap size as well and so you can use this to troubleshoot and figure out which objects in your application are causing the problem um so a pretty helpful uh little tool there now the other thing too is just some troubleshooting tips um quite often as the objects that are allocated in the middle of the span not necessarily when the jvm starts up or even when the jvm closes down that you’ll want to look at so it’s a good place to look but yeah that’s a great way of identifying the problem now in this example.
Fix Java memory Leaks
you can go in and you can remove that memory leak just by getting rid of that call to the 100 minus memory leak if you end up removing the same number of objects from the hash table that you put into it it can get garbage collected and it goes away and so i did a run after making that change when i go in and take a look at the run after making the change notice here’s the the memory leaks before and a look at the memory that’s con consumed here afterwards on a run where i get rid of the memory leak it’ll take just a second for it to come up you’ll notice right off the bat in the automated analysis it’s not giving me that error that i had before telling me that hey there was a really big problem in terms of heap size trend so that’s gone away um i still got you know it’s a little a lot of stuff in memory so it’s not crazy you can see that char is still consuming a lot of data but if you go in you’ll notice that this the memory usage is up and down nicely we don’t have that upward trend from bottom left to top right hand corner like we did on the other one i’m going to take a quick look at that and there is the outline and taking a look at the memory so you can see how that trends upwards and of course on the one after the memory leaks been taken away if you take a look at the live objects there’s actually nothing even sitting in there so
Java Flight Recorder and Mission Control
i mean that’s a great contrast of how the java mission control in javaflight recorder can help you identify what a leaking object is what the problem is in your code when compared to problematic code to code that doesn’t have memory leaks in it and there you go that’s how easy it is to use java flight recorder and java mission control to troubleshoot your java jvm jdk memory leaks without having to do a jvm heap dump and sort through that massive piece of data and there you go that’s how you identify your java memory leaks with java flight recorder and java mission control now it may not fix all your problems but you know identifying the source of the of the leak you know that’s kind of the first step in troubleshooting and fixing the whole problem now if you enjoy that tutorial head over to theserverside.com we’ve got lots of great tutorials on performance java mission control enterprise software development you name it if you’re interested in my personal antics you can always follow me on twitter at cameronmcnz and subscribe on the youtube

Here are some additional videos and articles of mine (Cameron McKenzie) about Java Mission Control and Java Flight Recorder: