WebLogic JDK Flight Recorder Profiling
This exercise will familiarize you with various elements of the new user interface. It also shows that it is possible to create integration with JFR and JMC from a party outside of the JDK, in this case the WebLogic Diagnostics Framework (WLDF). Even if you are not using WLS, this is a good exercise, as it walks through some powerful features in the JMC JFR user interface.
First open the file named 05_JFR_WLS/wldf.jfr. This recording contains, aside from the standard flight recorder events, events contributed by WLDF.
JDBC and JDK Flight Recorder
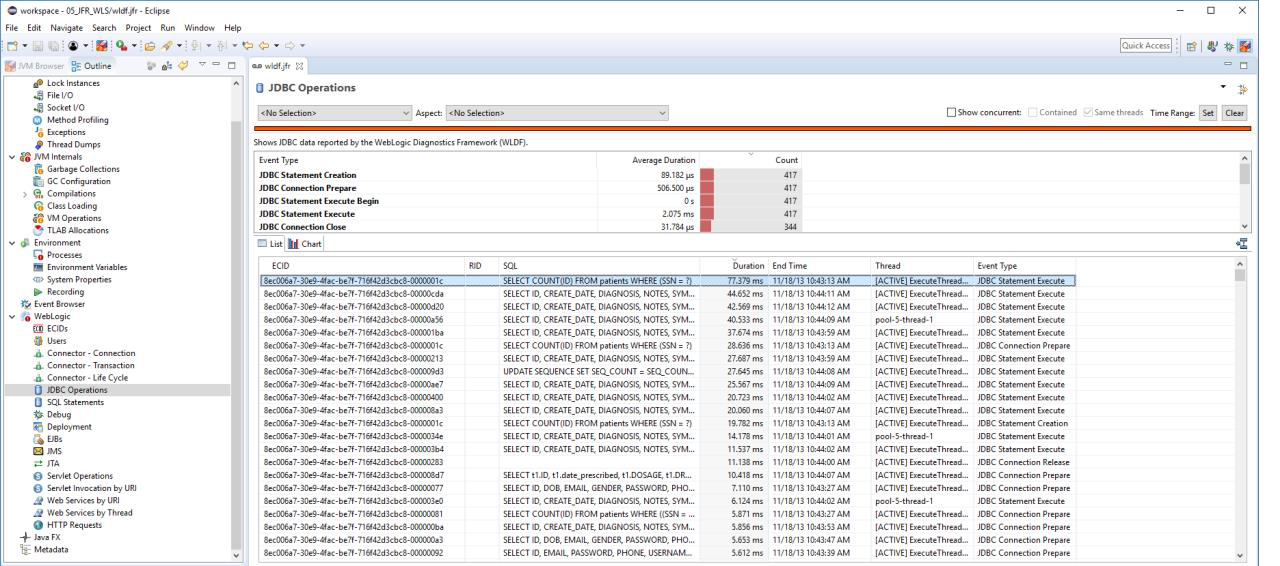
Open the WebLogic / JDBC Operations page. Can you tell which JDBC query took the longest time? How long did it take?
Open the WebLogic / Servlet Invocation by URI page. Can you tell which invocation of the viewPatients servlet took the longest time? How long did it take?
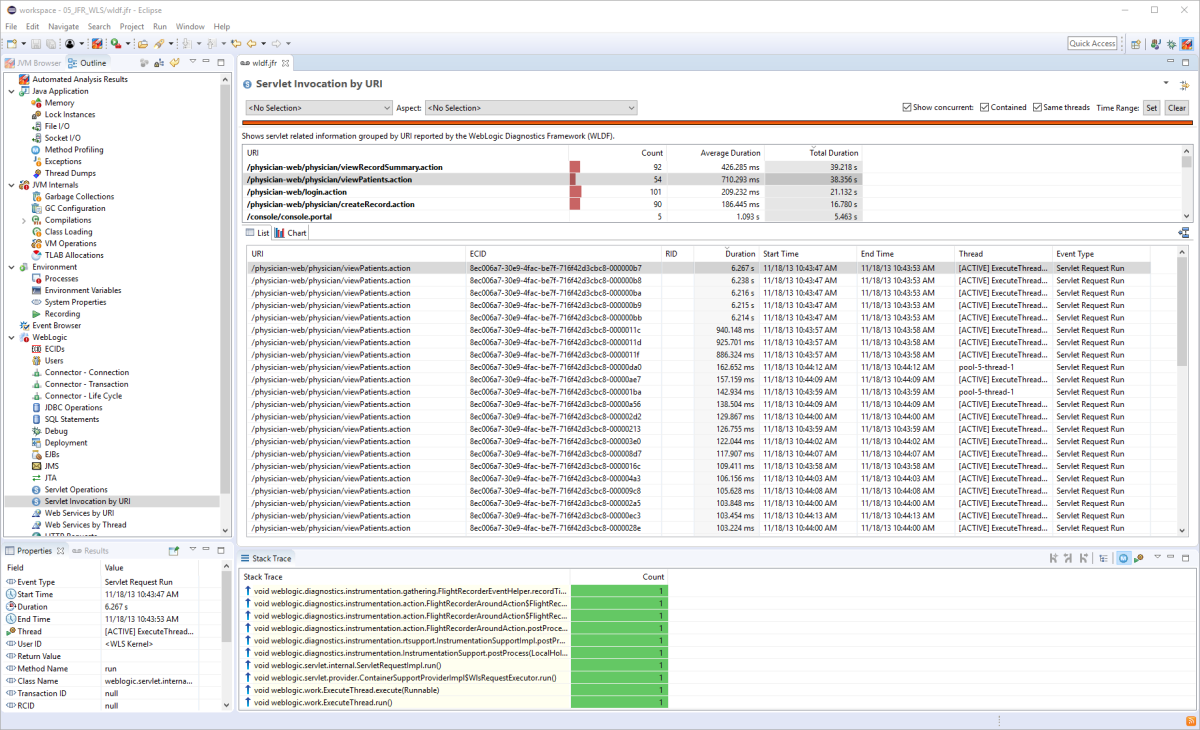
Let’s take a look at everything that was going on during that request. Select the longest lasting viewPatients servlet, and select the ECID (Execution Context ID) in the Properties view. An ECID is an identifier which follows a request through the system across process and thread boundaries. A little bit like an Open Tracing Span ID.
JDK Mission Control Selection Focus
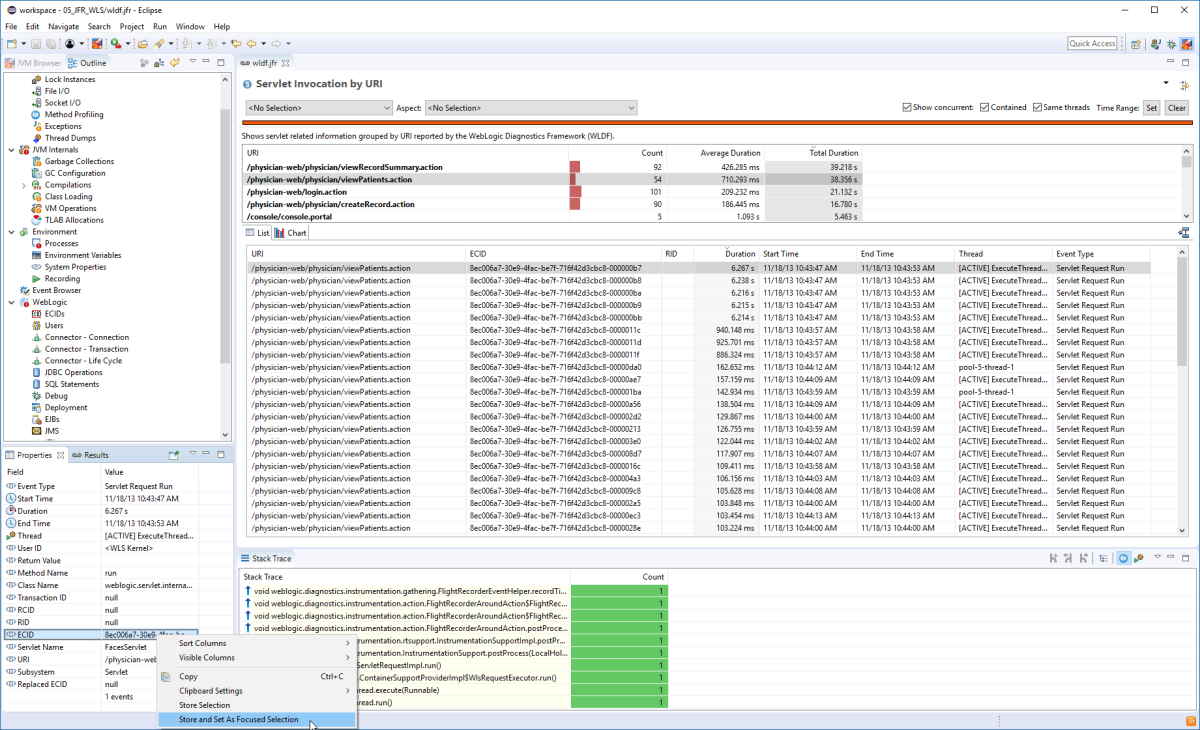
Select Store and set as focused selection from the context menu.
![eclipse jmc jfr weblogic servlet focused selection][eclipse-jmc-jfr-weblogic-servlet-focused-selection]
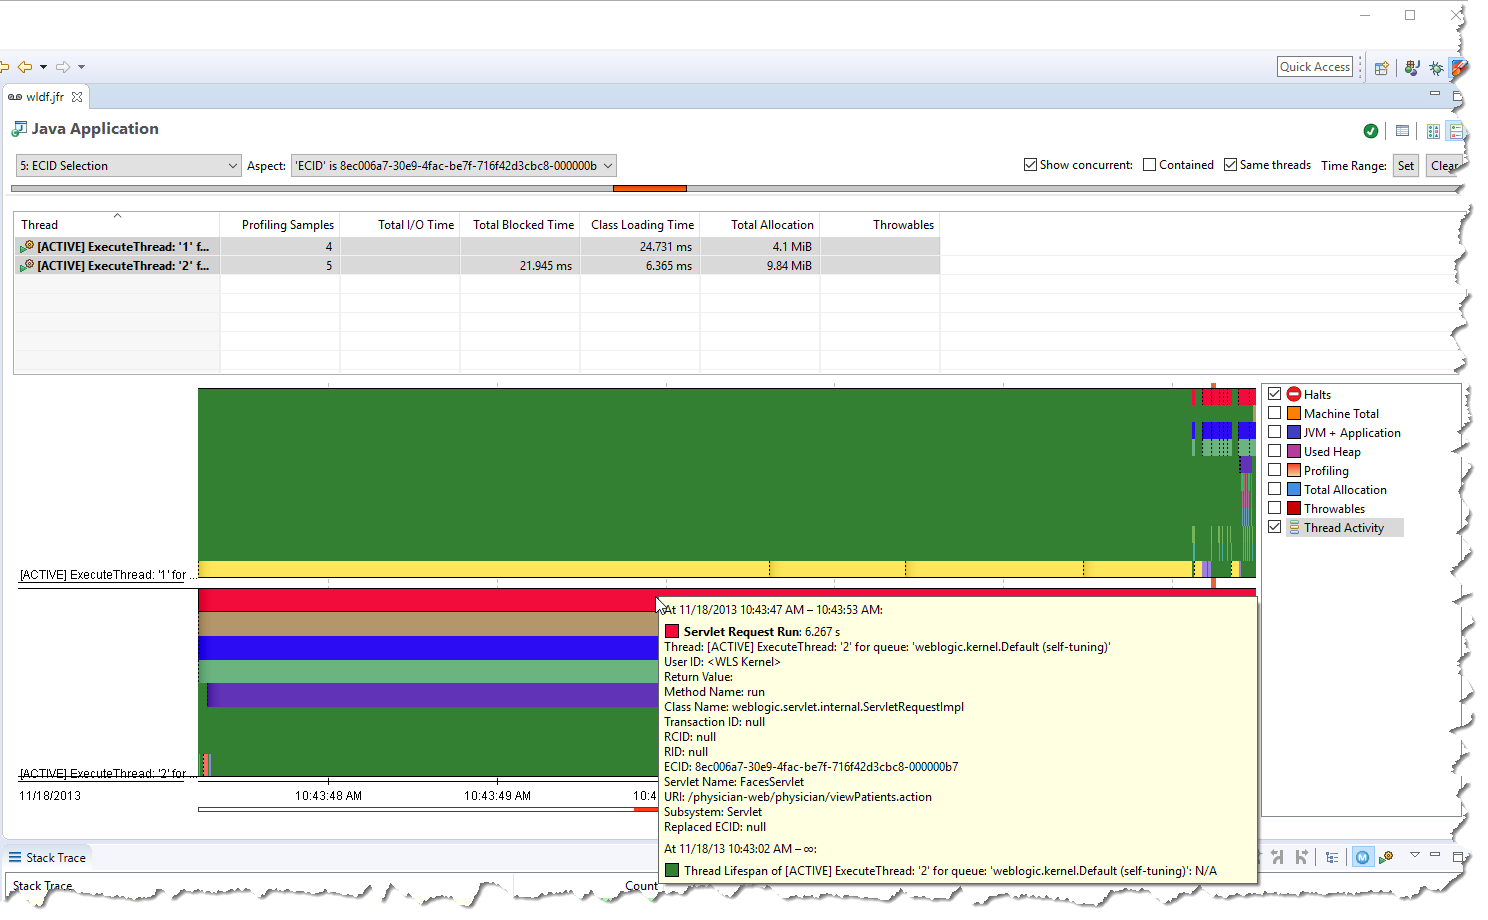
This will focus the user interface on events with the property value of that ECID. Open the Java Application page.
The selection box at the top shows that we are now looking at events matching our selection.
Also note that we can select other aspects of the selection to determine what the UI shows. Some pages may only be able to act on certain aspects of a selection. If the Show concurrent box is checked, events concurrent (happening during the same time interval) to the selection will also be showed. If Contained is checked, only events that is fully contained within the time range will be shown. If Same threads is selected, only the threads in the selection will be shown.
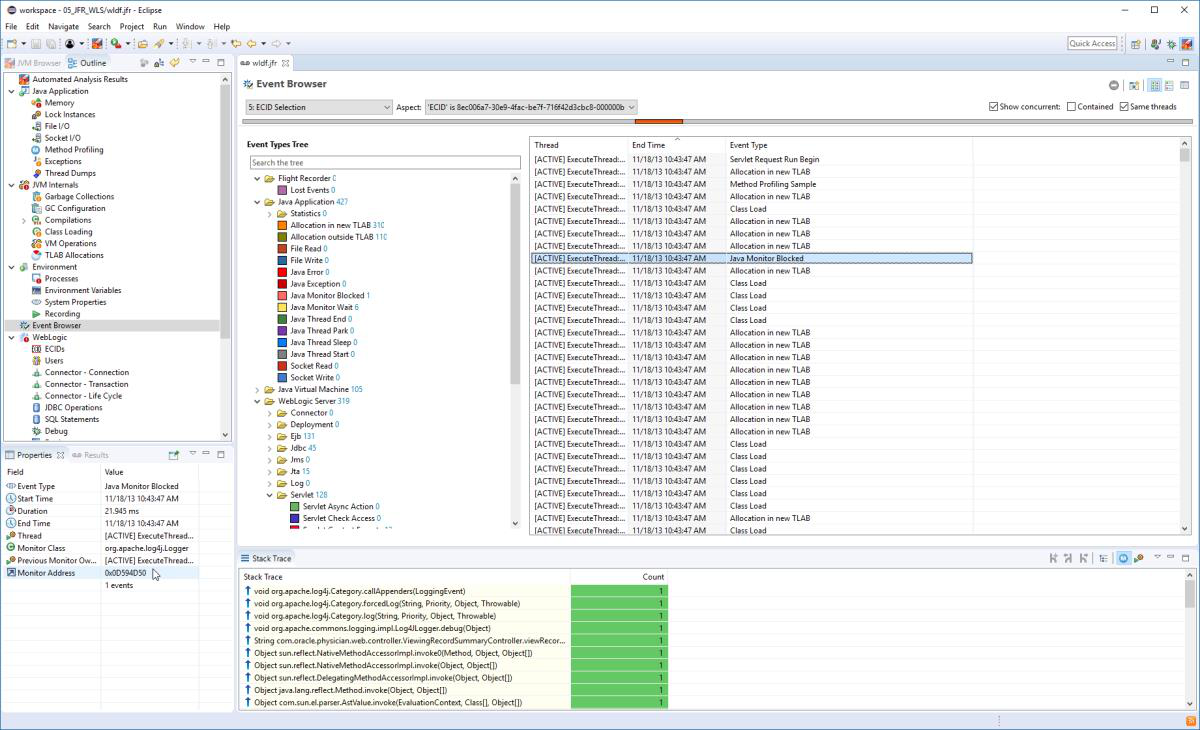
Check the Show concurrent and Same threads checkboxes. Next click the Set button to set the time range for the page to the time range of the active selection. Can you find any low-level events that do not have an ECID?
Note: There is, for example, a tiny bit of contention on a log4j logger in the beginning. The Blocking event does not have an ECID; it is shown due to “Show concurrent” being enabled.
Browse WebLogic JFR Events
Open the Event Browser page. Here you can look at the events grouped by Event Type. With our selection settings, we will now see the same events listed. Selecting an event will show the properties for the selected event in the Properties view. Selecting multiple events will show the common properties for the selection. As shown before, the properties can be used to establish new selections.
WebLogic and Mission Control Exercises:
- Can you find the aggregated stack traces for where the SQL statement taking the longest time to execute (on average) originated?
Hint: Go to the SQL Statements page, find the line in the table representing
the events with the longest average duration. Look at the stack traces from the
roots down.
- Can you find out which EJB the application seems to be spending the most time in on average?
- Which user seems to be starting the most transactions?
The moral of this exercise is that there are tools available that extend flight recorder and that can be quite useful/powerful. Also, using selections and aspects of a selection can be a useful way to focus the user interface. The Properties view can also be a source of selections.

Here are some additional videos and articles of mine (Cameron McKenzie) about Java Mission Control and Java Flight Recorder: