Java Garbage Collection Profiling with JFR and JMC
While JVM tuning is out of the scope for this set of exercises, this exercise will show how to get detailed information about the Garbage Collections that happened during the recording, and how to look at allocation profiling information.
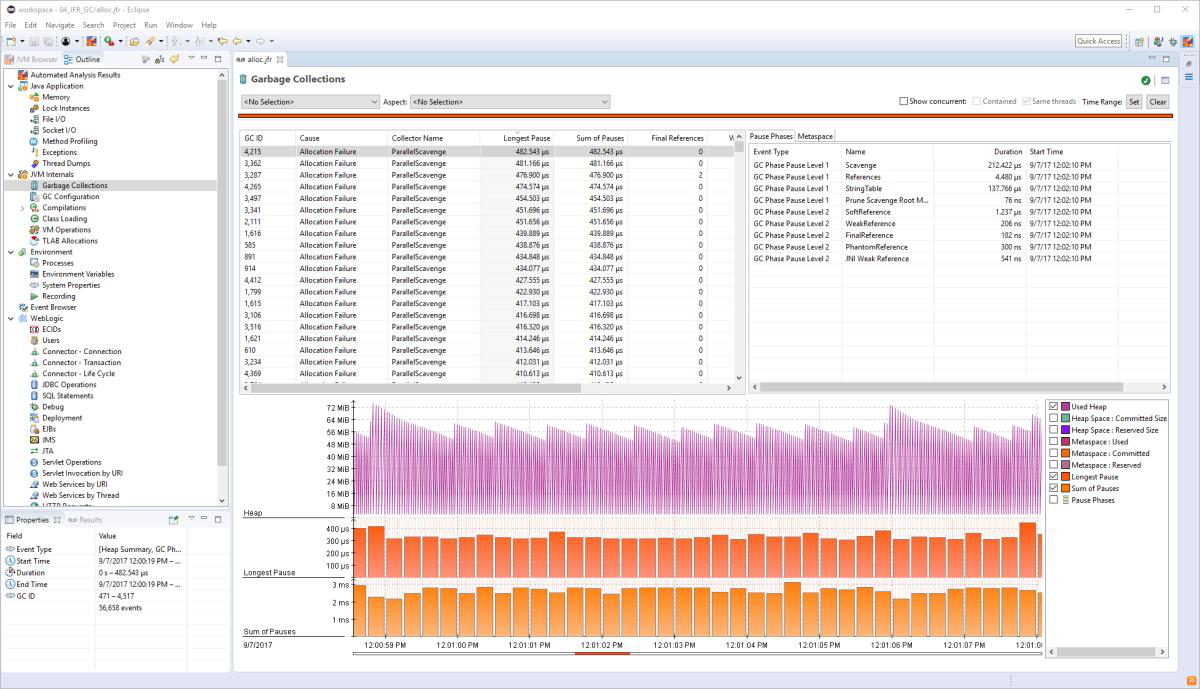
Open the allocator_before.jfr recording in the 04_JFR_GC project. Switch to the Mission Control perspective (if in Eclipse). Note that in JMC 6.0, the Automated Analysis doesn’t really show a clear signal here (it will in JMC 6.1). Instead, go to the Garbage Collections page.
In this page you can see many important aspects about each and every garbage collection that happened during the recording. As can be seen from the graph, garbage collections occur quite frequently.
Note: the charts can be zoomed with the mouse scroll wheel or with the key buttons (left/right to pan, up/down to zoom). If you want to use the keys to zoom/pan, make sure the chart panel is selected, for example by clicking on the x-axis underneath the charts.
Profile GC with Flight Recorder and Mission Control
It does not seem like there is anything special, like the handling of special reference types, causing garbage collections to take an unreasonably long time, not to mention that the garbage collections are pretty short. We are simply creating quite large amounts of garbage.
Go to the Memory page. What kind of allocations (what class of objects) seems to be causing the most pressure on the memory system? From where are they allocated?
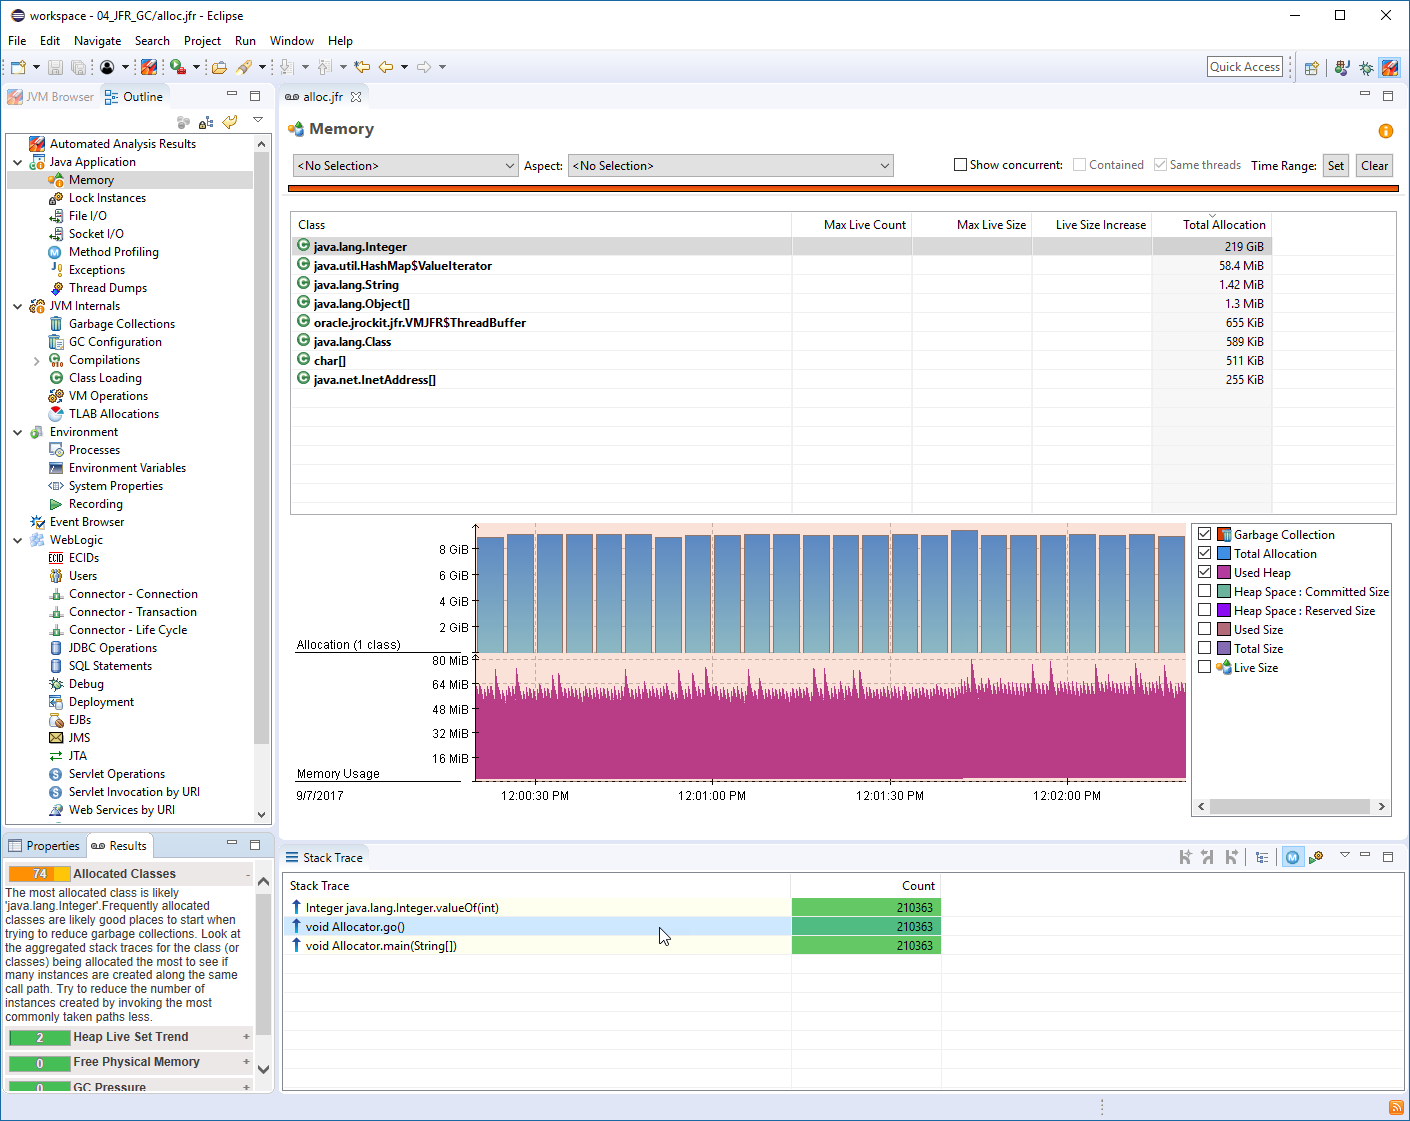
Note: Jump to the first method in the trace that you think you can easily alter.
JDK Mission Control Tutorial Exercises
Deep Dive Exercises:
- Can you, with a very simple rewrite of the inner MyAlloc class only, cause almost all object allocations to cease and almost no garbage collections to happen, while keeping the general idea of the program intact? You only need a minor change in two lines of the code. To see the difference, look at the allocator_after.jfr recording. How many garbage collections are there after the fix?
Note: Hints in the Readme.txt
- You can see even more detail if you go to the TLAB Allocations page. Does the TLAB size seem aptly sized for this application?
The moral of this exercise is that whilst the runtime will happily take care of any and all garbage that is thrown at it, a great deal of performance can be gained by not throwing unnecessary garbage at the poor unsuspecting runtime.

Here are some additional videos and articles of mine (Cameron McKenzie) about Java Mission Control and Java Flight Recorder: