JMX MBeans Browser & Server in JMC
Start the LoadAndDeadlock program from Exercise 2.1 so we can explore JMX MBeans and the MBeans browser.
Then switch to Eclipse’s Java Mission Control perspective. After a little while you should see the JVM running the LoadAndDeadlock class appearing in the JVM Browser. Open a console by selecting Start JMX Console from the context menu of the JVM running the LoadAndDeadlock class, or by expanding the LoadAndDeadlock JVM in the JVM Browser and double clicking on the MBean Server.
You should now be at the Overview tab of the Management Console. You should see something similar to the picture below:
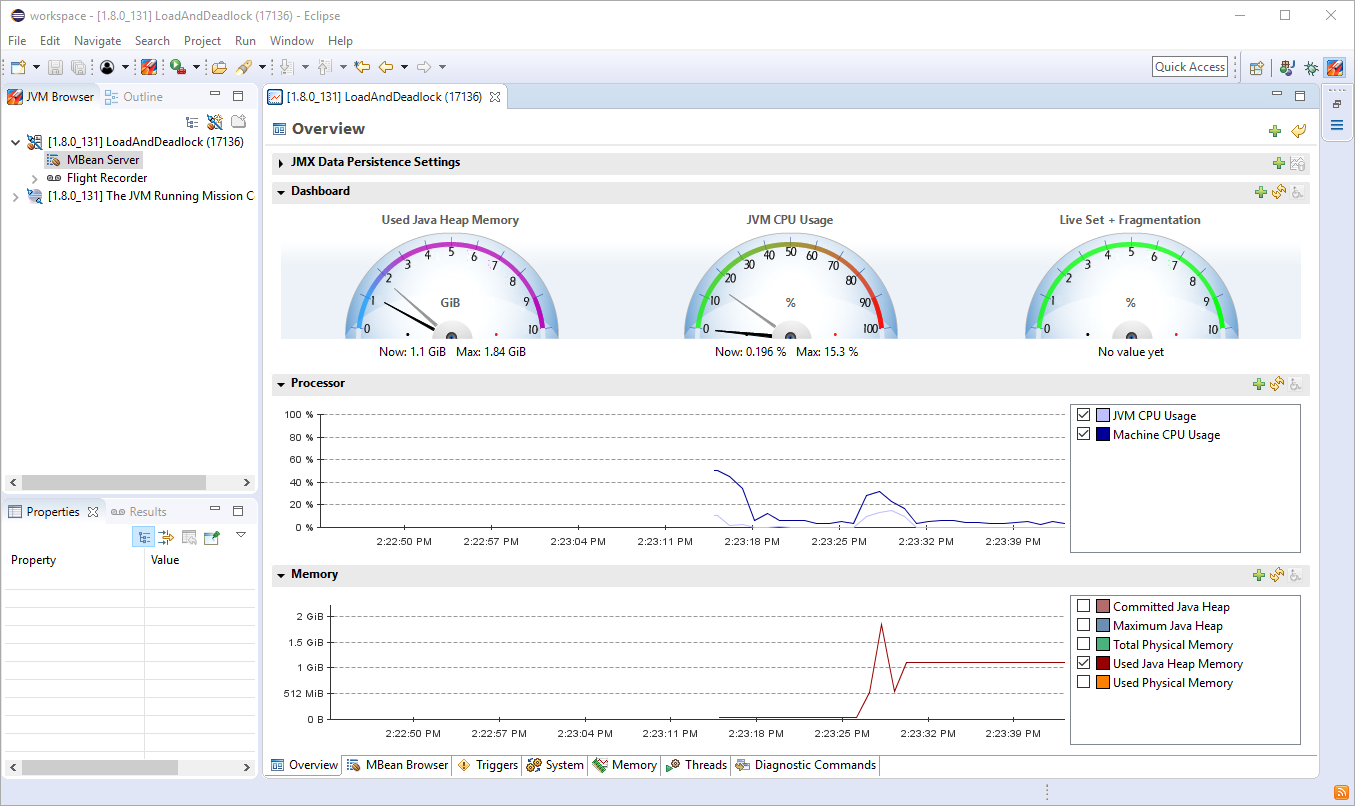
MBeans Management Console of Mission Control
In the overview tab you can remove charts, add new charts, add attributes to the charts, plot other attributes in the velocimeters, log the information in the charts to disk, freeze the charts to look at specific values, zoom and more.
Click on the Add chart button in the upper right corner of the console. This will add a new blank chart to JMC.
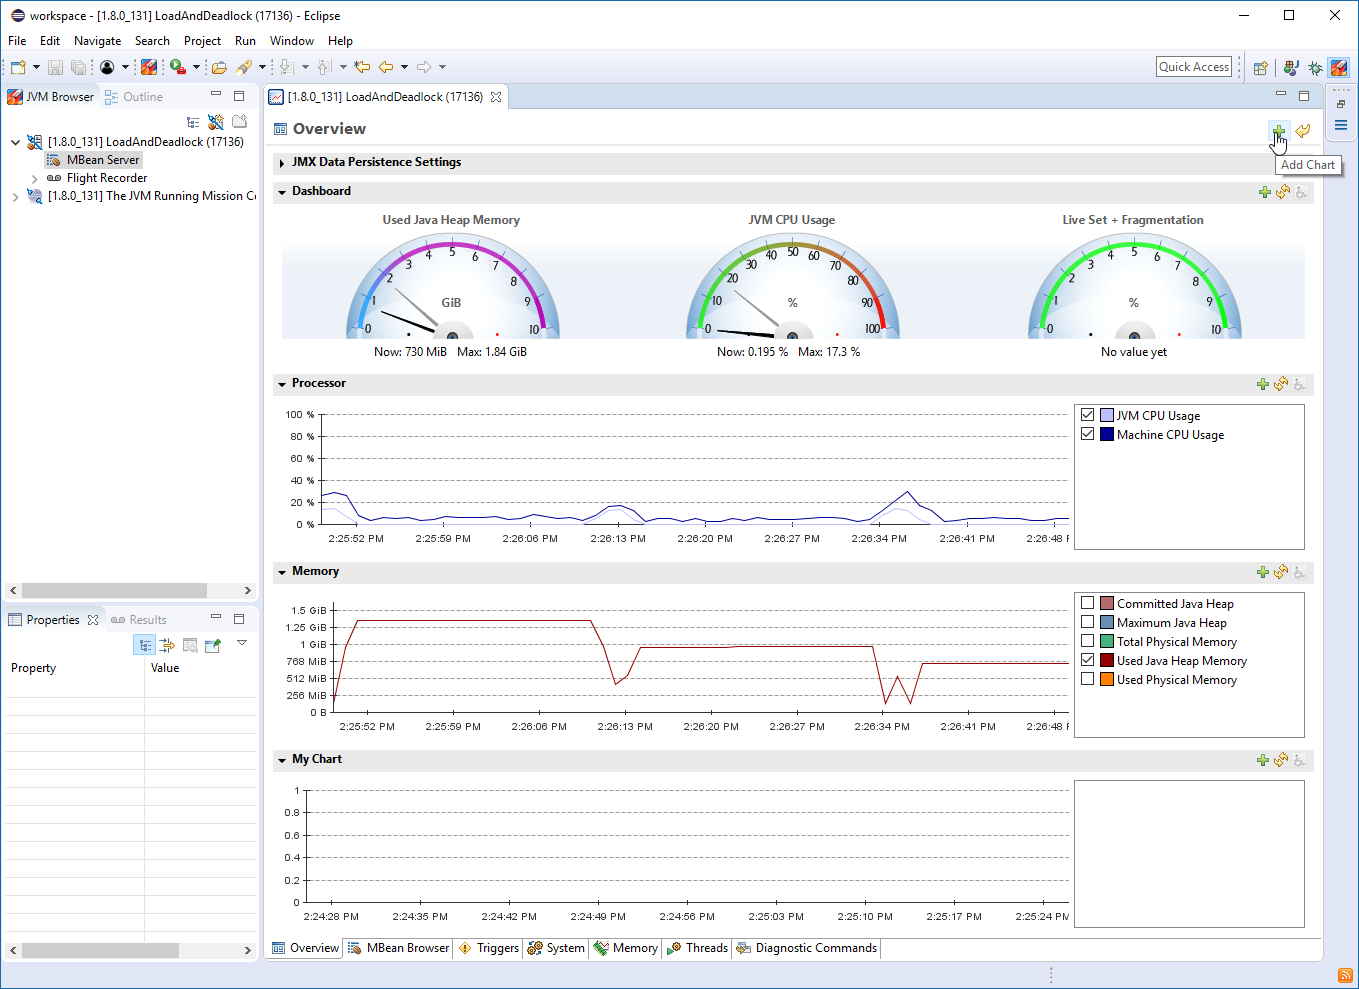
JVM Thread Count Monitor
Click the Add… button of the new chart. In the attribute selector dialog, go to the Filter text field and enter “Th” (without quotation marks). Select the ThreadCount attribute, and press ok. You should now see the thread count.
Note: You can use the context menu in the attribute list to change the color of the thread count graph. To change the titles in the chart, use the context menu of the chart.
MBeans Console Example Exercises
- Try changing the color of the chart.
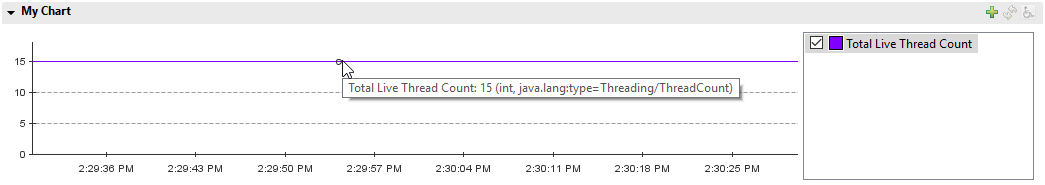
- Sometimes it can be hard to read the precise value in a chart. Freeze the graph and hover with the pointer over the thread count graph for a little while. What is your exact thread count?
- You decide that you dislike the live set attribute and warm up a bit to the Thread Count attribute. Remove the Live Set velocimeter in the upper right corner of the Overview tab, and instead add one for the Thread Count attribute.
JMX MBean Browser
The MBean browser is where you browse the MBeans available in the platform MBean server. If you expose your own application for monitoring through JMX and register them in the platform MBean server, your custom MBeans will show up here. You can use the MBean browser to look at specific values of attributes, change the update times for attributes, add attributes to charts, execute operations and more. Go to the MBean browser by clicking the MBean Browser tab.
What is the current garbage collection strategy for the old generation?
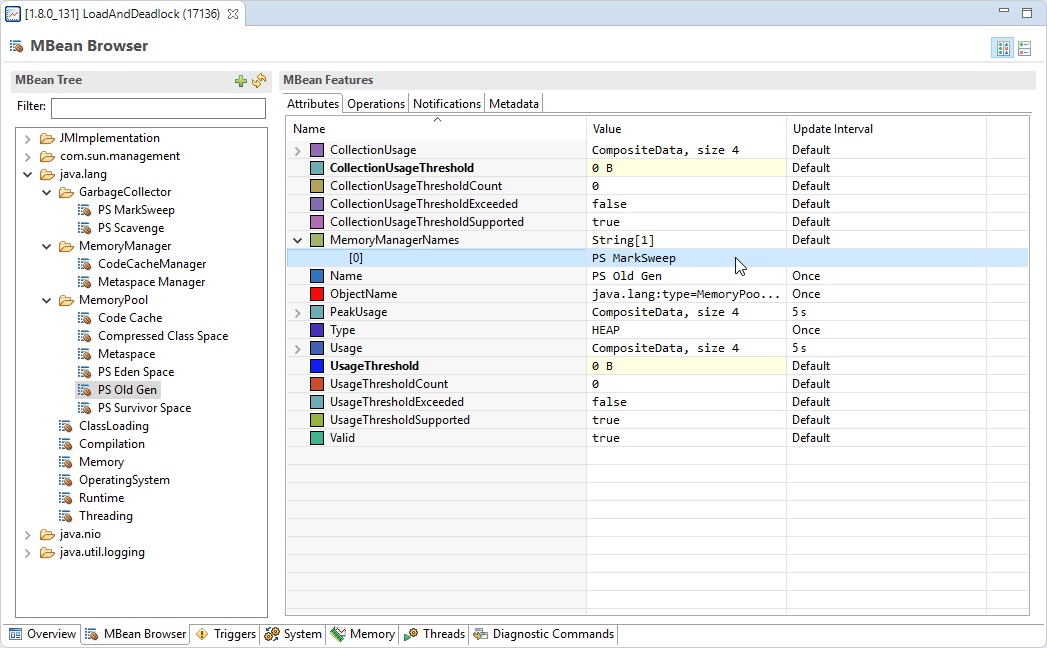
Note: Go to the java.lang domain, select the proper memory pool MBean and look for the MemoryManagerNames attribute in the Attribute table.
Threading MBean and ThreatCount
Whilst browsing the java.lang.Threading MBean, you encounter your old friend the ThreadCount attribute. You decide that you enjoy it so much that you wish to add it to yet another chart on the Overview tab. Right click on the attribute, select Visualize… Select Add new chart and click OK. Go back to the Overview tab and enjoy the Dual ThreadCount Plotting Experience™ for a brief moment. Then reset the user interface by clicking the Reset to Default Controls button in the upper right corner.
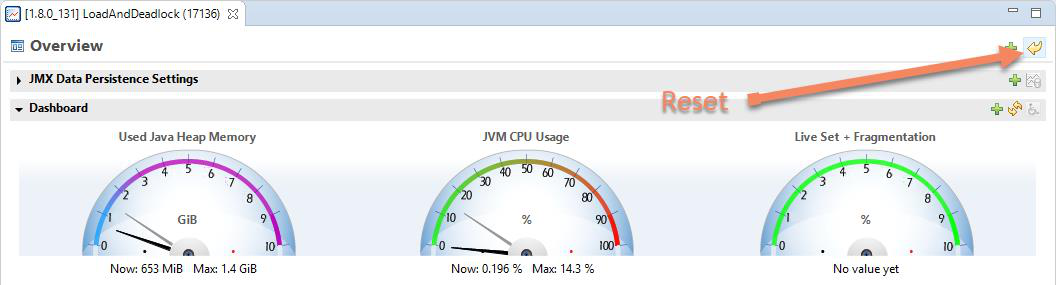
Note: In JMC, charts must contain values of the same content type. That is the reason why you cannot plot the ThreadCount attribute in the same chart as, say, the Memory attributes.
Deep Dive Exercises:
- Get a thread stack dump by executing the DiagnosticCommand print_threads.
Note: Browse to com.sun.management.DiagnosticCommand , select
the operations tab, select the threadPrint operation. Press the Execute button.
You will get a new time-stamped result view for each invocation of an
operation.
- Can you find a much simpler way of executing the Diagnostic Commands?
Note: Use the Diagnostic Command tab.
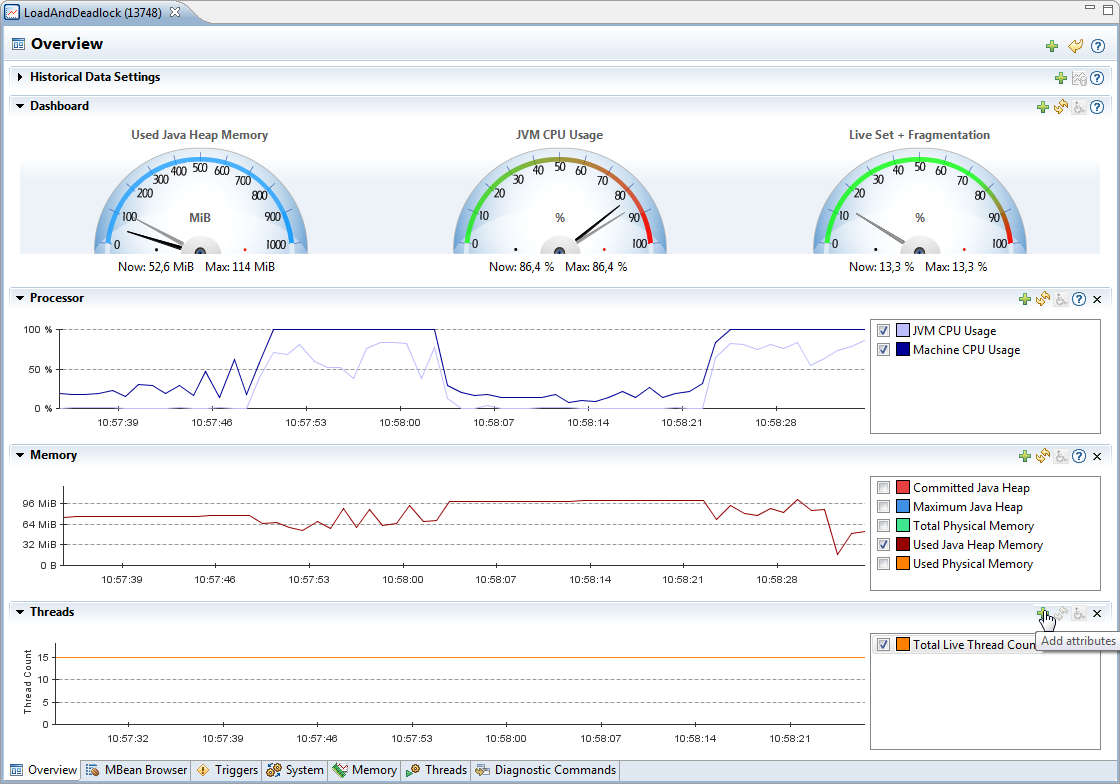
JMX JMC Threads View
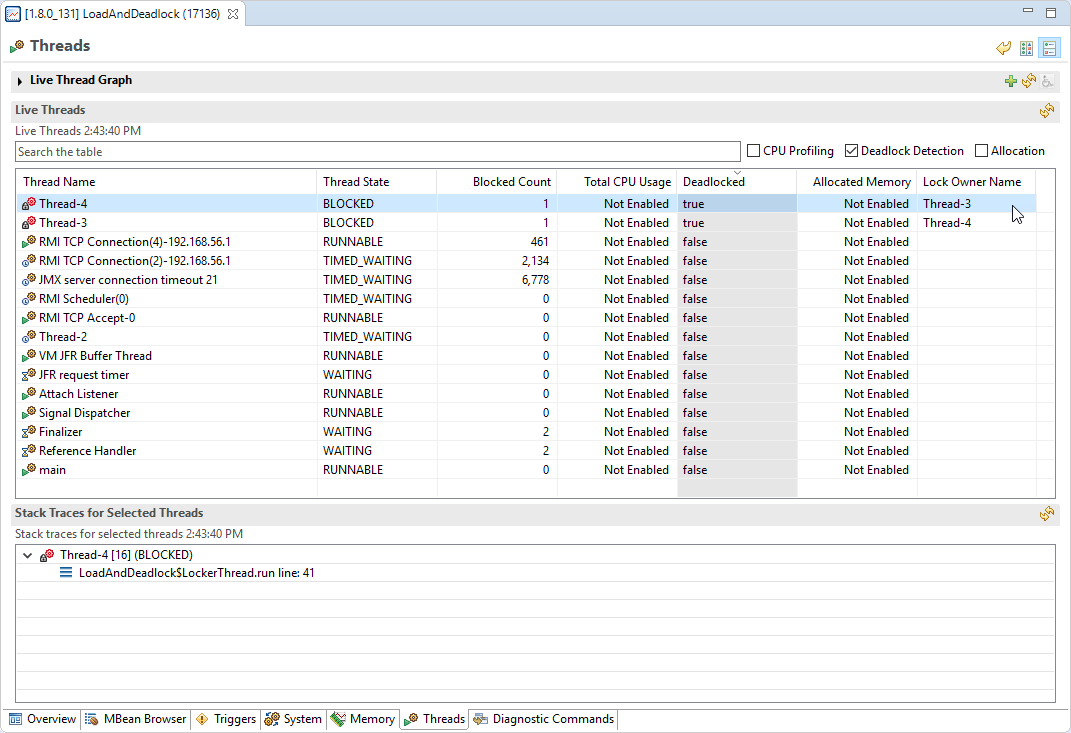
Short on time as we are, we skip to the Threads view. Rejoice at the discovery of our old friend the Thread Count attribute in the upper chart (needs to be unfolded)! In the threads view we can check if there are any deadlocked threads in our application. Turn on deadlock detection by checking the appropriate checkbox.
Deadlocked Threads
Next click on the Deadlocked column header to bring the deadlocked threads to the top.
Note: You can also turn off the automatic retrieval of new stack traces by clicking the Refresh Stack Traces icon next to the deadlock detection icon on the toolbar. This is usually a good idea while investigating something specific, as you may otherwise be interrupted by constant table refreshes.
What are the names of the deadlocked threads? In which method and on what line are they deadlocked?
Note: In most tables in Mission Control, there are columns that are not visualized by default. The visibility can be changed from the context menu in the table.
Flight Recorder & MBeans Example Exercise:
- If you run this from within Eclipse, you can jump to that line in the source and fix the problem. Right click on the offending stack frame and jump to the method in question.
How to Trigger Mission Control
Let’s set up an MBeans trigger that alerts us when the CPU load is above a certain value. Go to the Triggers tab. Click the Add… button. Select the ProcessCPULoad attribute and hit Next.
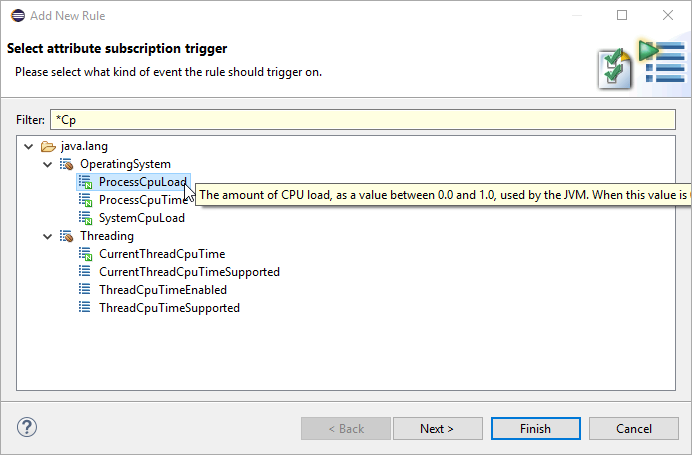
Select the Max trigger value to be 0. 3 (30%). And set the limit to once per second. Click Next.
There are a few different actions that can be taken when the rule triggers. There are custom actions downloadable from the update site, and it is also possible to add your own.
Application Alert Triggers
Let’s stick with the default (Application alert). Click Next. Constraints can be added to constrain when the action is allowed to be taken. We do not want any constraints for this trigger rule. Click Next once more. Enter a name that you will remember for the trigger rule, then hit Finish.
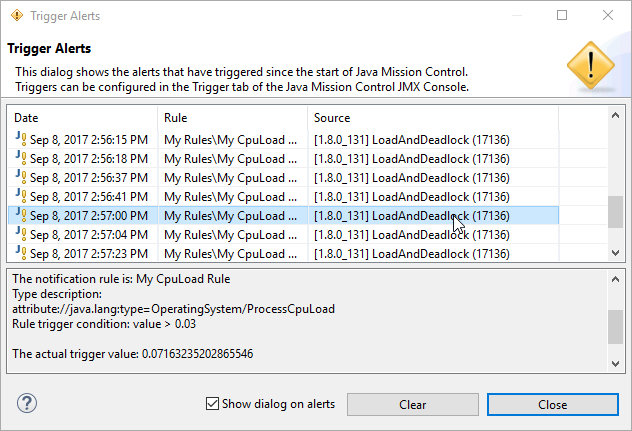
Trigger rules in Java Mission Control’s MBeans Console are by default inactive. Let’s enable the trigger by clicking the checkbox next to its name. The rule is now active. Move over to the Overview and wait for one of the computationally intense cycles to happen. The Alert dialog should appear and show you details about the particular event. If that isn’t enough to generate the necessary CPU load, try resizing Eclipse like crazy for more than a second.
Disable or remove the rule when done to avoid getting more notifications.

Here are some additional videos and articles of mine (Cameron McKenzie) about Java Mission Control and Java Flight Recorder: