
LinkedList vs HashSet Performance with Java Flight Recorder
One class of profiling problems deals with finding out where the application is spending the most time executing. Such a “hot spot” is usually a very good place to start optimizing your application, as any effort bringing down the computational overhead in such a method will affect the overall execution of the application a lot.
Like any good cooking show, we’ve provided you with pre-recorded recordings to save you from having to wait another few minutes for the recording to finish.
Open the 02_JFR_HotMethods/hotmethods_before.jfr recording.
The following code is used in the video at the top of this Java Flight Recorder performance tutorial. It differs slightly from the code used by Marcus Hirt’s HotMethods example
package com.mcnz.jmc;

import jdk.jfr.*;


/**
 * This is a JDK Flight Recorder event.
 */
@Label("Work")
@Category("02_JFR_HotMethods")
@Description("Data from one loop run in the worker thread")
public class WorkEvent extends jdk.jfr.Event {
	@Label("Intersection Size")
	@Description("The number of values that were the same in the two collections")
	private int intersectionSize;

	public int getIntersectionSize() {
		return intersectionSize;
	}

	public void setIntersectionSize(int intersectionSize) {
		this.intersectionSize = intersectionSize;
	}
}

package com.mcnz.jmc;
import java.util.*;


public class HotJavaMethodRunner implements Runnable {

	private static final int NUMBER_OF_THREADS = 8;

	public static void main(String[] args) throws Exception {
		ThreadGroup threadGroup = new ThreadGroup("Workers");
		Thread[] threads = new Thread[NUMBER_OF_THREADS];
		for (int i = 0; i < threads.length; i++) {
			threads[i] = new Thread(threadGroup, new HotJavaMethodRunner(), "Worker Thread " + i);
			threads[i].setDaemon(true);
			threads[i].start();
		}
		System.out.print("Press enter to quit!");
		System.out.flush();
		System.in.read();
	}

	public void run() {
		while (true) {
			WorkEvent event = new WorkEvent();
			Collection<Integer> firstBunch = new LinkedList<>();
			Collection<Integer> secondBunch = new LinkedList<>();

			//Collection<Integer> firstBunch = new HashSet<>();
			//Collection<Integer> secondBunch = new HashSet<>();

			event.begin();

			initialize(firstBunch, 3);
			initialize(secondBunch, 2);
			int intersectionSize = countMatches(firstBunch, secondBunch);

			event.setIntersectionSize(intersectionSize);
			event.commit();
			Thread.yield();
		}
	}

	public void initialize(Collection<Integer> collection, int modulus) {
		collection.clear();
		for (int i = 1; i < 100000; i++) {
			if ((i % modulus) != 0)
				collection.add(i);
		}
	}

	public int countMatches(Collection<Integer> first, Collection<Integer> second) {
		int count = 0;
		for (Integer i : first) {
			if (second.contains(i)) {
				count++;
			}
		}
		System.out.println(count);
		return count;
	}

}
Note: Switch to the Java perspective and open (double click) the recording in the 02_JFR_HotMethods project named hotmethods_before.jfr.
Switch back to the JDK Mission Control perspective once the recording is open. Even though you will be able to see the automated analysis page directly in the Java Perspective, the JDK Mission Control places the support views needed to effectively navigate and analyze flight recordings in the right places. Therefore, always remember to switch to the JDK Mission Control perspective when analyzing recordings.
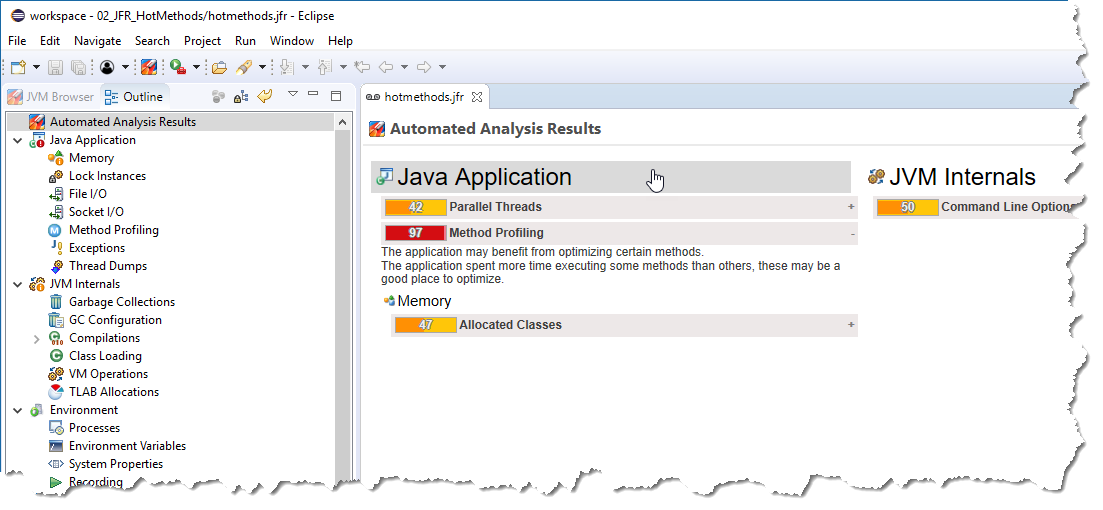
The automated analysis indicates that there is potential value in optimizing certain methods.
Since there is apparently interesting information in the Java Application tab, click on the Java Application header in the Automated Analysis Results page.
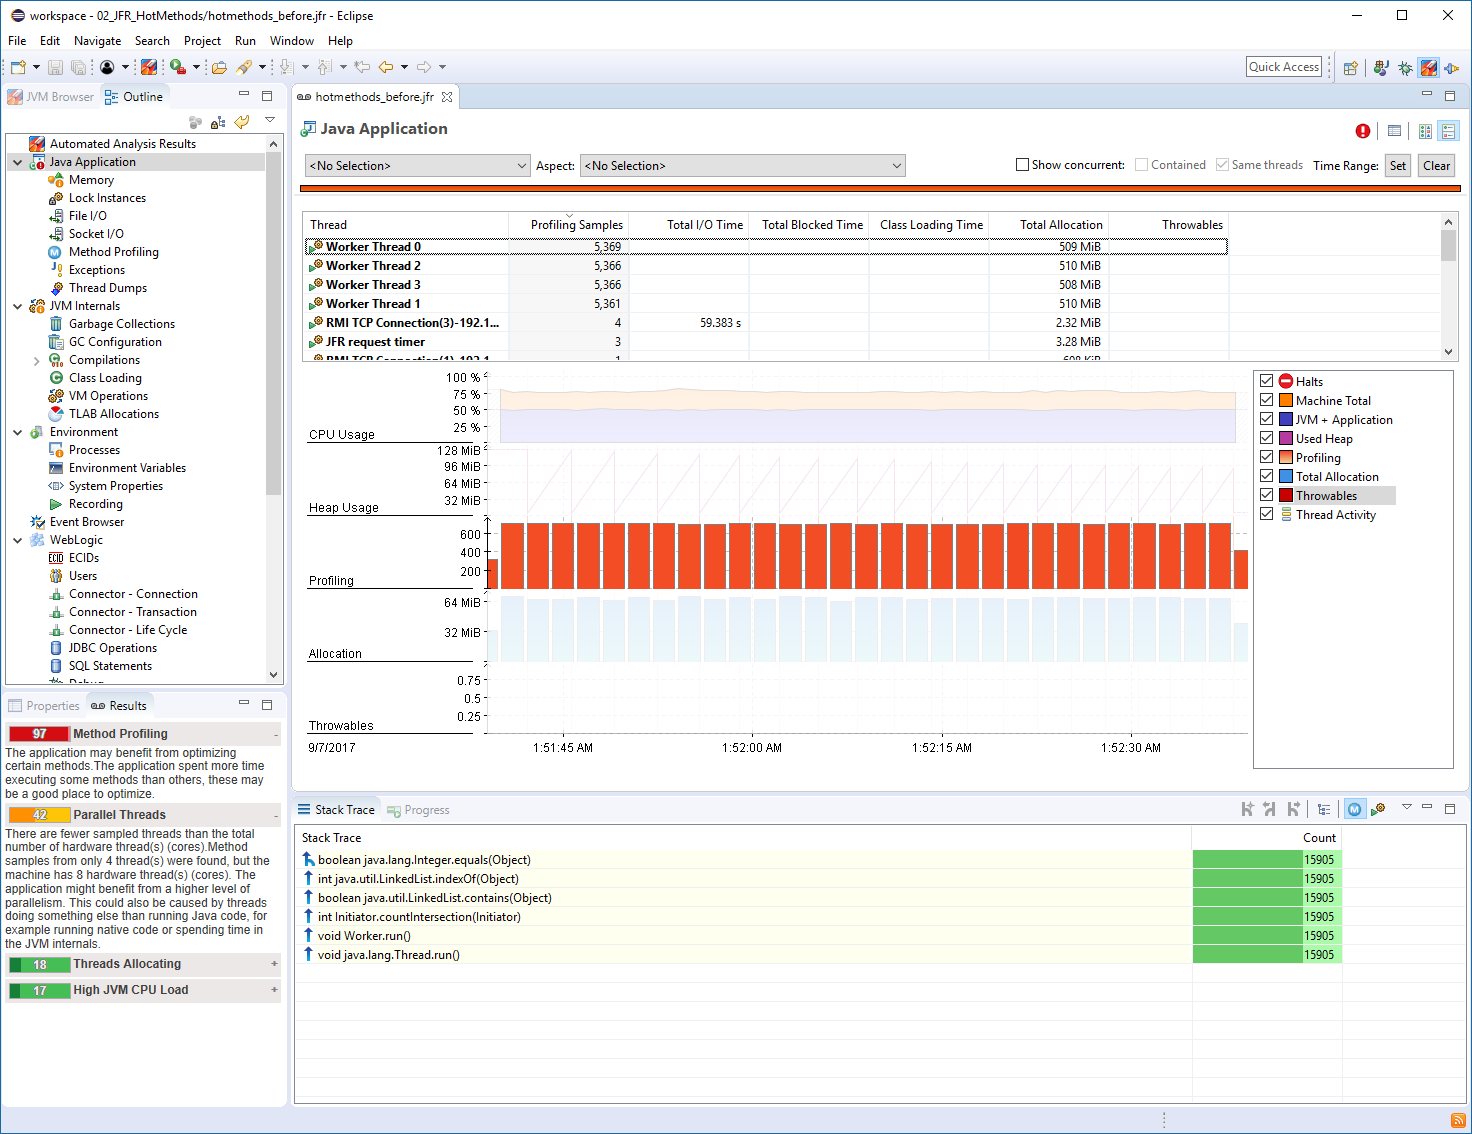 Next click on the Profiling lane. The stack trace view will show the aggregated stack
traces of any selection in the editor. It will now show you the stack traces for the
profiling samples.
Next click on the Profiling lane. The stack trace view will show the aggregated stack
traces of any selection in the editor. It will now show you the stack traces for the
profiling samples.
In the recording, one of these methods has a lot more samples than the others. This means that the JVM has spent more time executing that method relative to the other methods. Which method is the hottest one? From where do the calls to that method originate?
Which method do you think would be the best one to optimize to improve the performance of this application?
Note: Often the hotspot is in a method beyond your control. Look for a predecessor that you can affect.
There is another page, Method Profiling, that makes it easy to break down the method profiling samples per package and class of where the sample was captured.
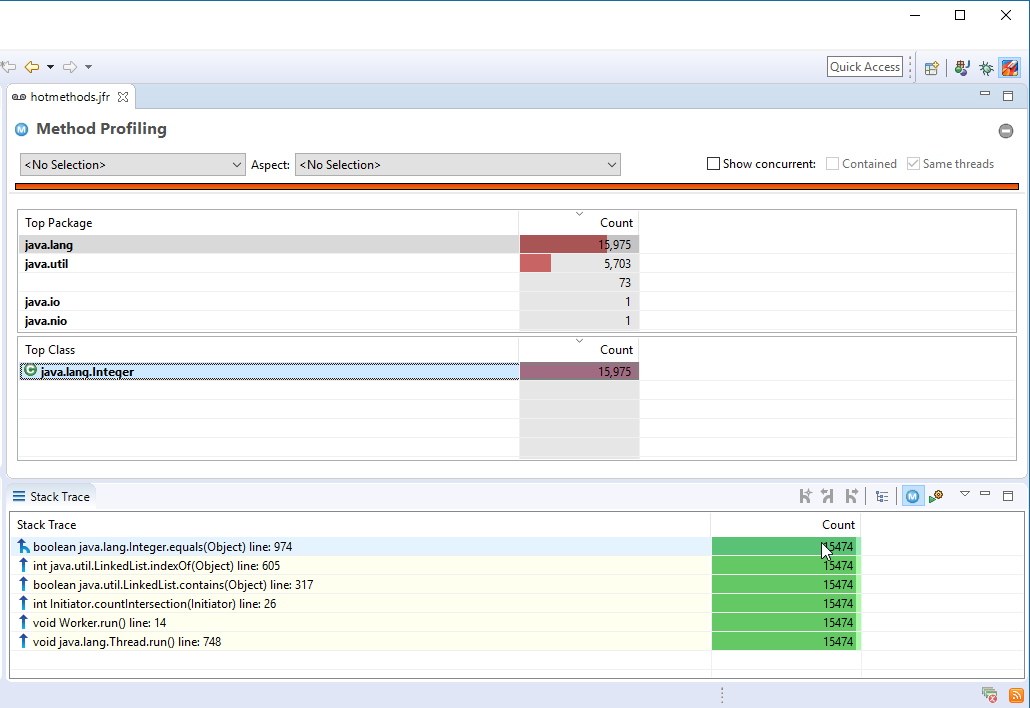 In the stack trace view, the most commonly traveled path is shown by default,
effectively giving you the most common stack trace directly. Wherever the path
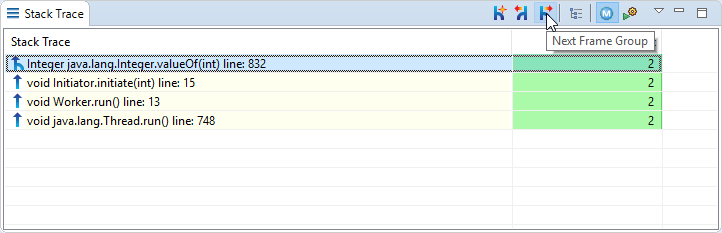
branches, there is a branch icon ( , ). You can use the right and left arrow keys to
select between the different branches (Frame Groups), or use the toolbar buttons
( , ):
In the stack trace view, the most commonly traveled path is shown by default,
effectively giving you the most common stack trace directly. Wherever the path
branches, there is a branch icon ( , ). You can use the right and left arrow keys to
select between the different branches (Frame Groups), or use the toolbar buttons
( , ):
 If you would rather use a tree representation, and see the aggregation done from the
thread roots, this can also be done:
If you would rather use a tree representation, and see the aggregation done from the
thread roots, this can also be done:
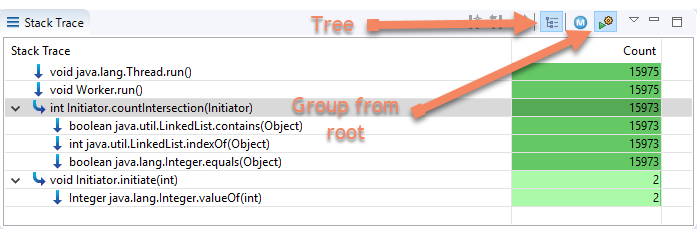 Note that there are no line numbers in the last screenshot. You can select at what
granularity to distinguish the frames from each other, in effect grouping frames
together. This is controlled from the context menu:
Note that there are no line numbers in the last screenshot. You can select at what
granularity to distinguish the frames from each other, in effect grouping frames
together. This is controlled from the context menu:
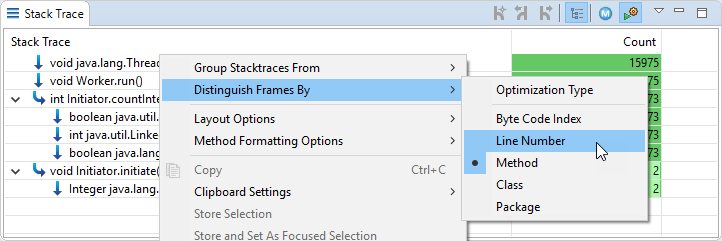 Using Method will often be a helpful tool to declutter the view.
Deep Dive Exercises:
- Can you, by changing one line of code, make the program much more effective (more than a factor 10)?
Note: If you get stuck, help can be found in the Readme.txt file in the projects.
Note: To save resources, remember to close the flight recordings you no
longer need.
- Is it possible to do another recording to figure out how much faster the program became after the change?
Note: The application generates custom events for each unit of “work” do ne.
This makes it easy to compare the time it takes to complete a unit of work
before and after the code change. Would it be possible to decide how faster
the program became without these custom events?
The moral of the exercise is that no matter how fast the JVM is, it can never save you from poor choices in algorithms and data structures.

Here are some additional videos and articles of mine (Cameron McKenzie) about Java Mission Control and Java Flight Recorder: